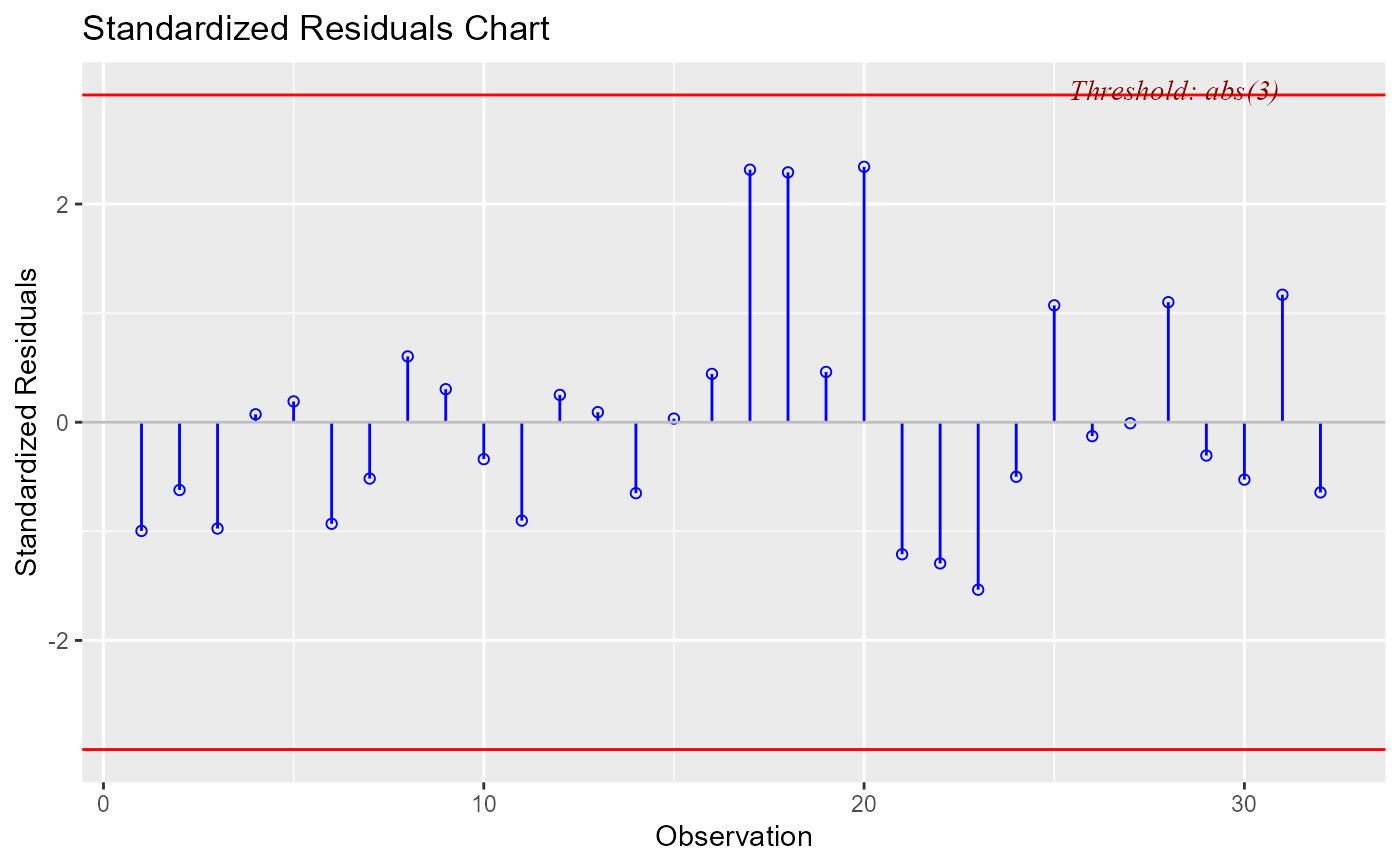
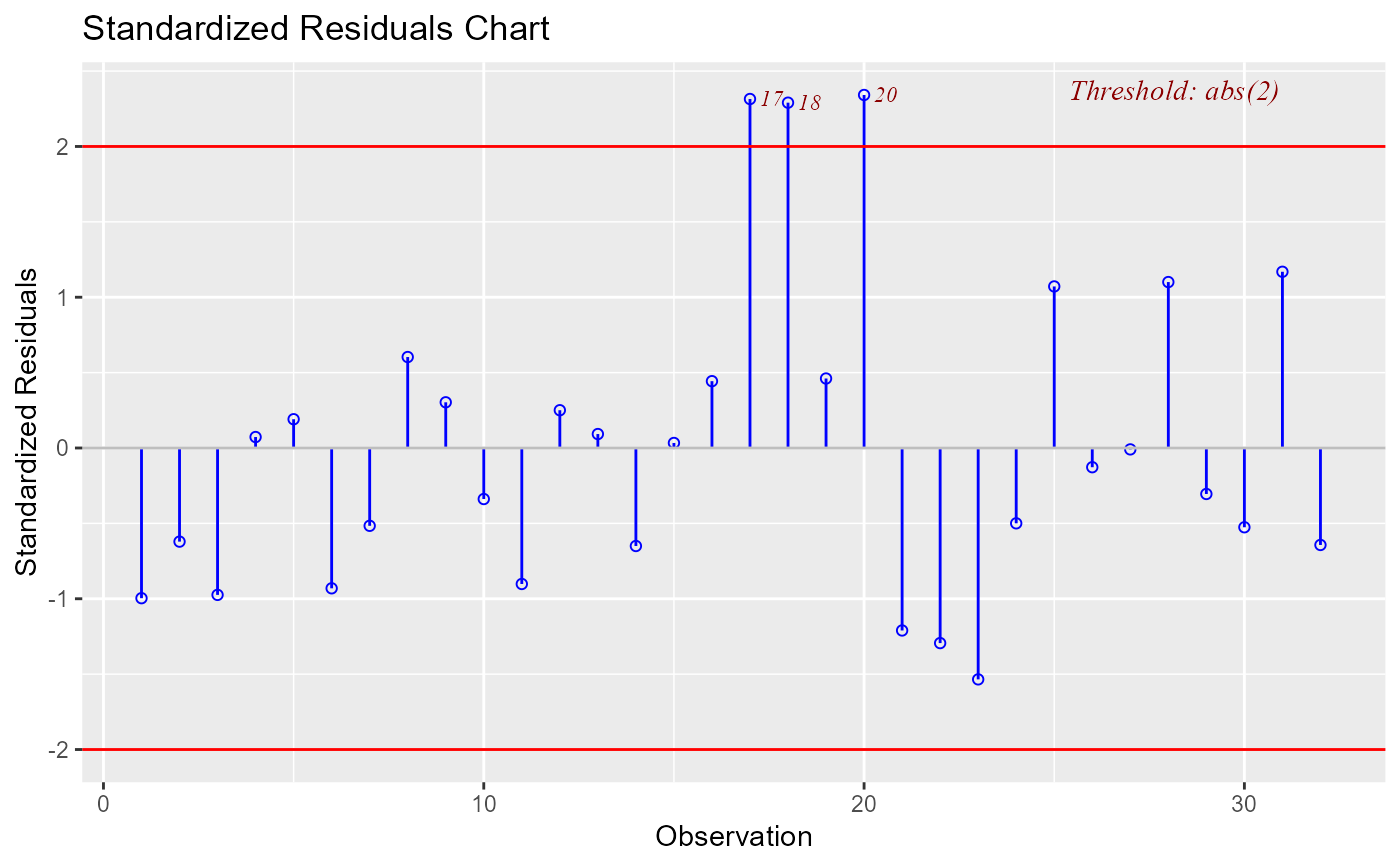
Chart for identifying outliers.
Arguments
- model
An object of class
lm.- threshold
Threshold for detecting outliers. Default is 2.
- print_plot
logical; if
TRUE, prints the plot else returns a plot object.
Value
ols_plot_resid_stand returns a list containing the
following components:
- outliers
a
data.framewith observation number andstandardized resiudalsthat exceedthreshold
for classifying an observation as an outlier
- threshold
thresholdfor classifying an observation as an outlier
Details
Standardized residual (internally studentized) is the residual divided by estimated standard deviation.
Examples
model <- lm(mpg ~ disp + hp + wt, data = mtcars)
ols_plot_resid_stand(model)

ols_plot_resid_stand(model, threshold = 3)