Select the subset of predictors that do the best at meeting some well-defined objective criterion, such as having the largest R2 value or the smallest MSE, Mallow's Cp or AIC. The default metric used for selecting the model is R2 but the user can choose any of the other available metrics.
Usage
ols_step_best_subset(model, ...)

# S3 method for default
ols_step_best_subset(
  model,
  max_order = NULL,
  include = NULL,
  exclude = NULL,
  metric = c("rsquare", "adjr", "predrsq", "cp", "aic", "sbic", "sbc", "msep", "fpe",
    "apc", "hsp"),
  ...
)

# S3 method for ols_step_best_subset
plot(x, model = NA, print_plot = TRUE, ...)
Arguments
- model
An object of class
lm.- ...
Other inputs.
- max_order
Maximum subset order.
- include
Character or numeric vector; variables to be included in selection process.
- exclude
Character or numeric vector; variables to be excluded from selection process.
- metric
Metric to select model.
- x
An object of class
ols_step_best_subset.- print_plot
logical; if
TRUE, prints the plot else returns a plot object.
Value
ols_step_best_subset returns an object of class "ols_step_best_subset".
An object of class "ols_step_best_subset" is a list containing the following:
- metrics
selection metrics
References
Kutner, MH, Nachtscheim CJ, Neter J and Li W., 2004, Applied Linear Statistical Models (5th edition). Chicago, IL., McGraw Hill/Irwin.
Examples
model <- lm(mpg ~ disp + hp + wt + qsec, data = mtcars)
ols_step_best_subset(model)
#> Best Subsets Regression
#> ------------------------------
#> Model Index Predictors
#> ------------------------------
#> 1 wt
#> 2 hp wt
#> 3 hp wt qsec
#> 4 disp hp wt qsec
#> ------------------------------
#>
#> Subsets Regression Summary
#> ---------------------------------------------------------------------------------------------------------------------------------
#> Adj. Pred
#> Model R-Square R-Square R-Square C(p) AIC SBIC SBC MSEP FPE HSP APC
#> ---------------------------------------------------------------------------------------------------------------------------------
#> 1 0.7528 0.7446 0.7087 12.4809 166.0294 74.2916 170.4266 296.9167 9.8572 0.3199 0.2801
#> 2 0.8268 0.8148 0.7811 2.3690 156.6523 66.5755 162.5153 215.5104 7.3563 0.2402 0.2091
#> 3 0.8348 0.8171 0.782 3.0617 157.1426 67.7238 164.4713 213.1929 7.4756 0.2461 0.2124
#> 4 0.8351 0.8107 0.771 5.0000 159.0696 70.0408 167.8640 220.8882 7.9497 0.2644 0.2259
#> ---------------------------------------------------------------------------------------------------------------------------------
#> AIC: Akaike Information Criteria
#> SBIC: Sawa's Bayesian Information Criteria
#> SBC: Schwarz Bayesian Criteria
#> MSEP: Estimated error of prediction, assuming multivariate normality
#> FPE: Final Prediction Error
#> HSP: Hocking's Sp
#> APC: Amemiya Prediction Criteria
#>
ols_step_best_subset(model, metric = "adjr")
#> Best Subsets Regression
#> ------------------------------
#> Model Index Predictors
#> ------------------------------
#> 1 wt
#> 2 hp wt
#> 3 hp wt qsec
#> 4 disp hp wt qsec
#> ------------------------------
#>
#> Subsets Regression Summary
#> ---------------------------------------------------------------------------------------------------------------------------------
#> Adj. Pred
#> Model R-Square R-Square R-Square C(p) AIC SBIC SBC MSEP FPE HSP APC
#> ---------------------------------------------------------------------------------------------------------------------------------
#> 1 0.7528 0.7446 0.7087 12.4809 166.0294 74.2916 170.4266 296.9167 9.8572 0.3199 0.2801
#> 2 0.8268 0.8148 0.7811 2.3690 156.6523 66.5755 162.5153 215.5104 7.3563 0.2402 0.2091
#> 3 0.8348 0.8171 0.782 3.0617 157.1426 67.7238 164.4713 213.1929 7.4756 0.2461 0.2124
#> 4 0.8351 0.8107 0.771 5.0000 159.0696 70.0408 167.8640 220.8882 7.9497 0.2644 0.2259
#> ---------------------------------------------------------------------------------------------------------------------------------
#> AIC: Akaike Information Criteria
#> SBIC: Sawa's Bayesian Information Criteria
#> SBC: Schwarz Bayesian Criteria
#> MSEP: Estimated error of prediction, assuming multivariate normality
#> FPE: Final Prediction Error
#> HSP: Hocking's Sp
#> APC: Amemiya Prediction Criteria
#>
ols_step_best_subset(model, metric = "cp")
#> Best Subsets Regression
#> ------------------------------
#> Model Index Predictors
#> ------------------------------
#> 1 wt
#> 2 hp wt
#> 3 hp wt qsec
#> 4 disp hp wt qsec
#> ------------------------------
#>
#> Subsets Regression Summary
#> ---------------------------------------------------------------------------------------------------------------------------------
#> Adj. Pred
#> Model R-Square R-Square R-Square C(p) AIC SBIC SBC MSEP FPE HSP APC
#> ---------------------------------------------------------------------------------------------------------------------------------
#> 1 0.7528 0.7446 0.7087 12.4809 166.0294 74.2916 170.4266 296.9167 9.8572 0.3199 0.2801
#> 2 0.8268 0.8148 0.7811 2.3690 156.6523 66.5755 162.5153 215.5104 7.3563 0.2402 0.2091
#> 3 0.8348 0.8171 0.782 3.0617 157.1426 67.7238 164.4713 213.1929 7.4756 0.2461 0.2124
#> 4 0.8351 0.8107 0.771 5.0000 159.0696 70.0408 167.8640 220.8882 7.9497 0.2644 0.2259
#> ---------------------------------------------------------------------------------------------------------------------------------
#> AIC: Akaike Information Criteria
#> SBIC: Sawa's Bayesian Information Criteria
#> SBC: Schwarz Bayesian Criteria
#> MSEP: Estimated error of prediction, assuming multivariate normality
#> FPE: Final Prediction Error
#> HSP: Hocking's Sp
#> APC: Amemiya Prediction Criteria
#>
# maximum subset
model <- lm(mpg ~ disp + hp + drat + wt + qsec, data = mtcars)
ols_step_best_subset(model, max_order = 3)
#> Best Subsets Regression
#> ---------------------------
#> Model Index Predictors
#> ---------------------------
#> 1 wt
#> 2 hp wt
#> 3 drat wt qsec
#> ---------------------------
#>
#> Subsets Regression Summary
#> ---------------------------------------------------------------------------------------------------------------------------------
#> Adj. Pred
#> Model R-Square R-Square R-Square C(p) AIC SBIC SBC MSEP FPE HSP APC
#> ---------------------------------------------------------------------------------------------------------------------------------
#> 1 0.7528 0.7446 0.7087 14.5346 166.0294 74.1040 170.4266 296.9167 9.8572 0.3199 0.2801
#> 2 0.8268 0.8148 0.7811 3.8082 156.6523 66.2706 162.5153 215.5104 7.3563 0.2402 0.2091
#> 3 0.8370 0.8196 0.7765 4.0467 156.7031 66.9790 164.0318 210.2851 7.3736 0.2428 0.2095
#> ---------------------------------------------------------------------------------------------------------------------------------
#> AIC: Akaike Information Criteria
#> SBIC: Sawa's Bayesian Information Criteria
#> SBC: Schwarz Bayesian Criteria
#> MSEP: Estimated error of prediction, assuming multivariate normality
#> FPE: Final Prediction Error
#> HSP: Hocking's Sp
#> APC: Amemiya Prediction Criteria
#>
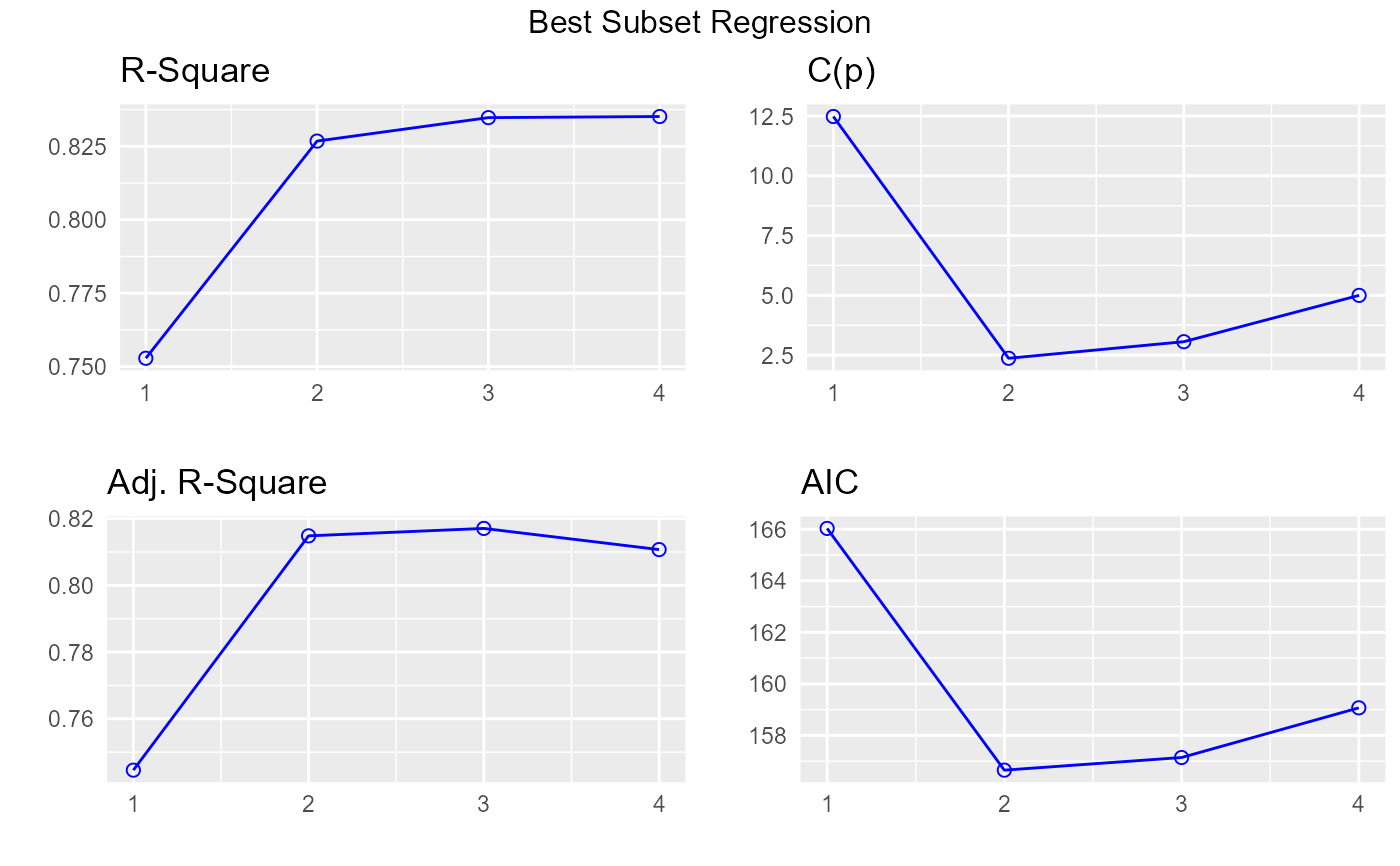
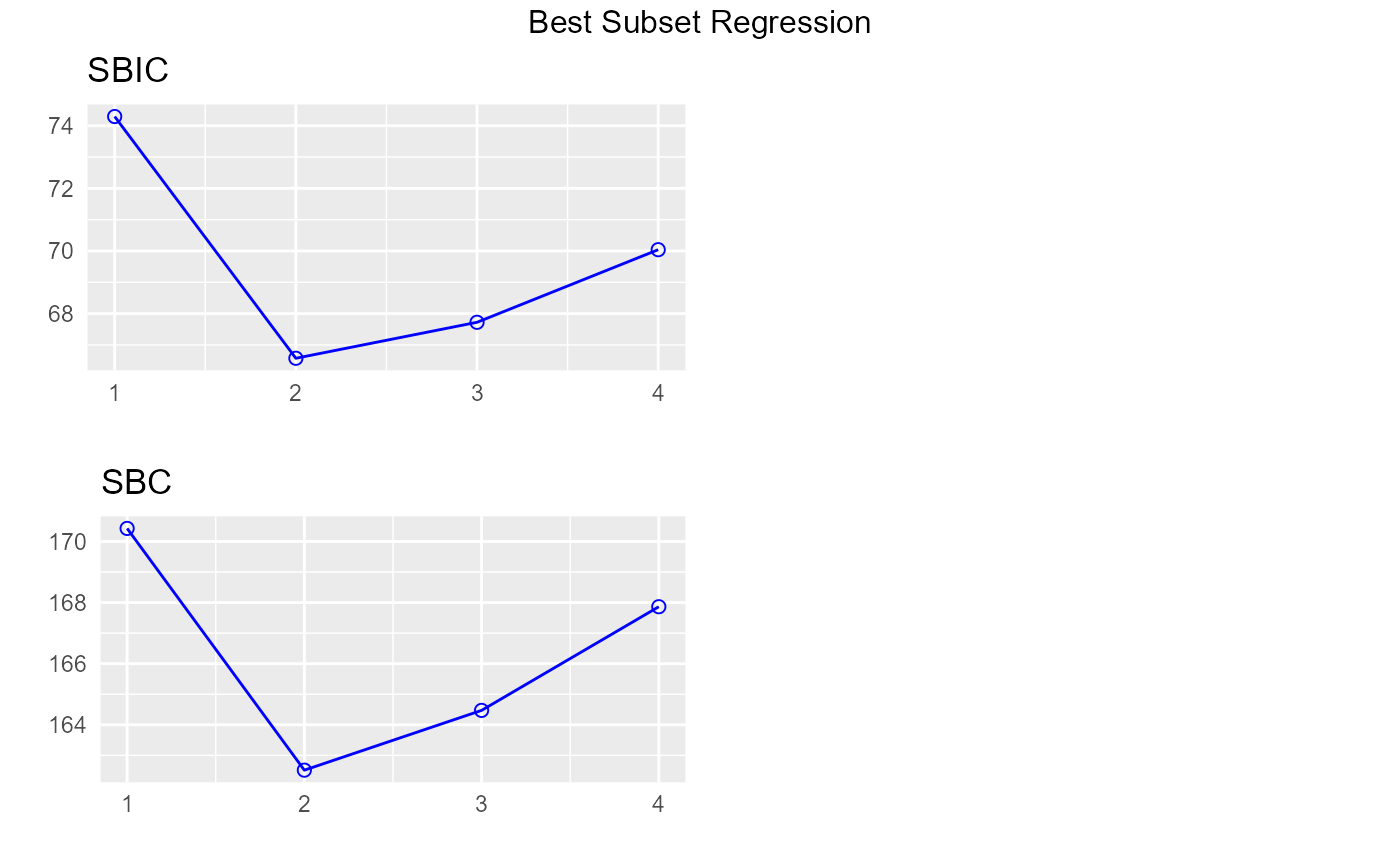
# plot
model <- lm(mpg ~ disp + hp + wt + qsec, data = mtcars)
k <- ols_step_best_subset(model)
plot(k)
 # return only models including `qsec`
ols_step_best_subset(model, include = c("qsec"))
#> Best Subsets Regression
#> ------------------------------
#> Model Index Predictors
#> ------------------------------
#> 1 qsec
#> 2 wt qsec
#> 3 hp wt qsec
#> 4 disp hp wt qsec
#> ------------------------------
#>
#> Subsets Regression Summary
#> ------------------------------------------------------------------------------------------------------------------------------------
#> Adj. Pred
#> Model R-Square R-Square R-Square C(p) AIC SBIC SBC MSEP FPE HSP APC
#> ------------------------------------------------------------------------------------------------------------------------------------
#> 1 0.1753 0.1478 0.0754 107.0696 204.5881 109.5591 208.9853 990.6990 32.8899 1.0674 0.9347
#> 2 0.8264 0.8144 0.7786 2.4295 156.7205 66.6304 162.5834 215.9699 7.3720 0.2407 0.2095
#> 3 0.8348 0.8171 0.782 3.0617 157.1426 67.7238 164.4713 213.1929 7.4756 0.2461 0.2124
#> 4 0.8351 0.8107 0.771 5.0000 159.0696 70.0408 167.8640 220.8882 7.9497 0.2644 0.2259
#> ------------------------------------------------------------------------------------------------------------------------------------
#> AIC: Akaike Information Criteria
#> SBIC: Sawa's Bayesian Information Criteria
#> SBC: Schwarz Bayesian Criteria
#> MSEP: Estimated error of prediction, assuming multivariate normality
#> FPE: Final Prediction Error
#> HSP: Hocking's Sp
#> APC: Amemiya Prediction Criteria
#>
# exclude `hp` from selection process
ols_step_best_subset(model, exclude = c("hp"))
#> Best Subsets Regression
#> ---------------------------
#> Model Index Predictors
#> ---------------------------
#> 1 wt
#> 2 wt qsec
#> 3 disp wt qsec
#> ---------------------------
#>
#> Subsets Regression Summary
#> ---------------------------------------------------------------------------------------------------------------------------------
#> Adj. Pred
#> Model R-Square R-Square R-Square C(p) AIC SBIC SBC MSEP FPE HSP APC
#> ---------------------------------------------------------------------------------------------------------------------------------
#> 1 0.7528 0.7446 0.7087 12.4809 166.0294 74.2916 170.4266 296.9167 9.8572 0.3199 0.2801
#> 2 0.8264 0.8144 0.7786 2.4295 156.7205 66.6304 162.5834 215.9699 7.3720 0.2407 0.2095
#> 3 0.8264 0.8078 0.7699 4.4293 158.7203 68.8815 166.0490 223.9676 7.8534 0.2585 0.2232
#> ---------------------------------------------------------------------------------------------------------------------------------
#> AIC: Akaike Information Criteria
#> SBIC: Sawa's Bayesian Information Criteria
#> SBC: Schwarz Bayesian Criteria
#> MSEP: Estimated error of prediction, assuming multivariate normality
#> FPE: Final Prediction Error
#> HSP: Hocking's Sp
#> APC: Amemiya Prediction Criteria
#>
# return only models including `qsec`
ols_step_best_subset(model, include = c("qsec"))
#> Best Subsets Regression
#> ------------------------------
#> Model Index Predictors
#> ------------------------------
#> 1 qsec
#> 2 wt qsec
#> 3 hp wt qsec
#> 4 disp hp wt qsec
#> ------------------------------
#>
#> Subsets Regression Summary
#> ------------------------------------------------------------------------------------------------------------------------------------
#> Adj. Pred
#> Model R-Square R-Square R-Square C(p) AIC SBIC SBC MSEP FPE HSP APC
#> ------------------------------------------------------------------------------------------------------------------------------------
#> 1 0.1753 0.1478 0.0754 107.0696 204.5881 109.5591 208.9853 990.6990 32.8899 1.0674 0.9347
#> 2 0.8264 0.8144 0.7786 2.4295 156.7205 66.6304 162.5834 215.9699 7.3720 0.2407 0.2095
#> 3 0.8348 0.8171 0.782 3.0617 157.1426 67.7238 164.4713 213.1929 7.4756 0.2461 0.2124
#> 4 0.8351 0.8107 0.771 5.0000 159.0696 70.0408 167.8640 220.8882 7.9497 0.2644 0.2259
#> ------------------------------------------------------------------------------------------------------------------------------------
#> AIC: Akaike Information Criteria
#> SBIC: Sawa's Bayesian Information Criteria
#> SBC: Schwarz Bayesian Criteria
#> MSEP: Estimated error of prediction, assuming multivariate normality
#> FPE: Final Prediction Error
#> HSP: Hocking's Sp
#> APC: Amemiya Prediction Criteria
#>
# exclude `hp` from selection process
ols_step_best_subset(model, exclude = c("hp"))
#> Best Subsets Regression
#> ---------------------------
#> Model Index Predictors
#> ---------------------------
#> 1 wt
#> 2 wt qsec
#> 3 disp wt qsec
#> ---------------------------
#>
#> Subsets Regression Summary
#> ---------------------------------------------------------------------------------------------------------------------------------
#> Adj. Pred
#> Model R-Square R-Square R-Square C(p) AIC SBIC SBC MSEP FPE HSP APC
#> ---------------------------------------------------------------------------------------------------------------------------------
#> 1 0.7528 0.7446 0.7087 12.4809 166.0294 74.2916 170.4266 296.9167 9.8572 0.3199 0.2801
#> 2 0.8264 0.8144 0.7786 2.4295 156.7205 66.6304 162.5834 215.9699 7.3720 0.2407 0.2095
#> 3 0.8264 0.8078 0.7699 4.4293 158.7203 68.8815 166.0490 223.9676 7.8534 0.2585 0.2232
#> ---------------------------------------------------------------------------------------------------------------------------------
#> AIC: Akaike Information Criteria
#> SBIC: Sawa's Bayesian Information Criteria
#> SBC: Schwarz Bayesian Criteria
#> MSEP: Estimated error of prediction, assuming multivariate normality
#> FPE: Final Prediction Error
#> HSP: Hocking's Sp
#> APC: Amemiya Prediction Criteria
#>