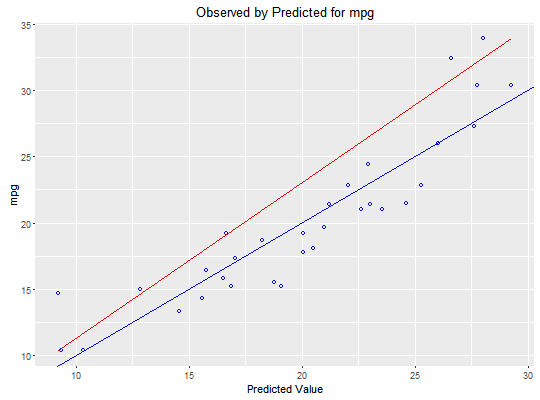
Plot of observed vs fitted values to assess the fit of the model.
ovsp_plot(model)
lm
model <- lm(mpg ~ disp + hp + wt, data = mtcars)
ovsp_plot(model)