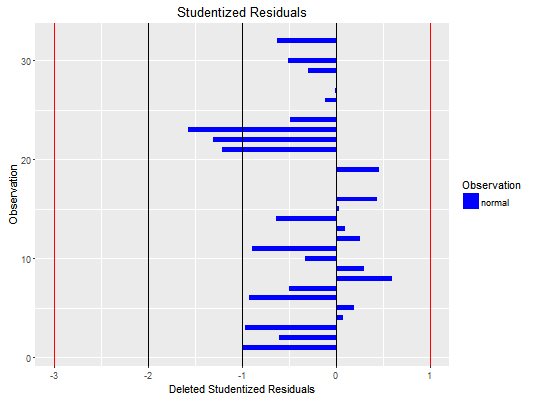
Studentized Residual Plot
Graph for identifying outliers
srplot(model)
Arguments
- model
- an object of class
lm
Examples
model <- lm(mpg ~ disp + hp + wt, data = mtcars)
srplot(model)#> Warning: Removed 6 rows containing missing values (position_stack).#> Warning: Stacking not well defined when ymin != 0