Residual plus component plot
Source:R/ols-residual-plus-component-plot.R
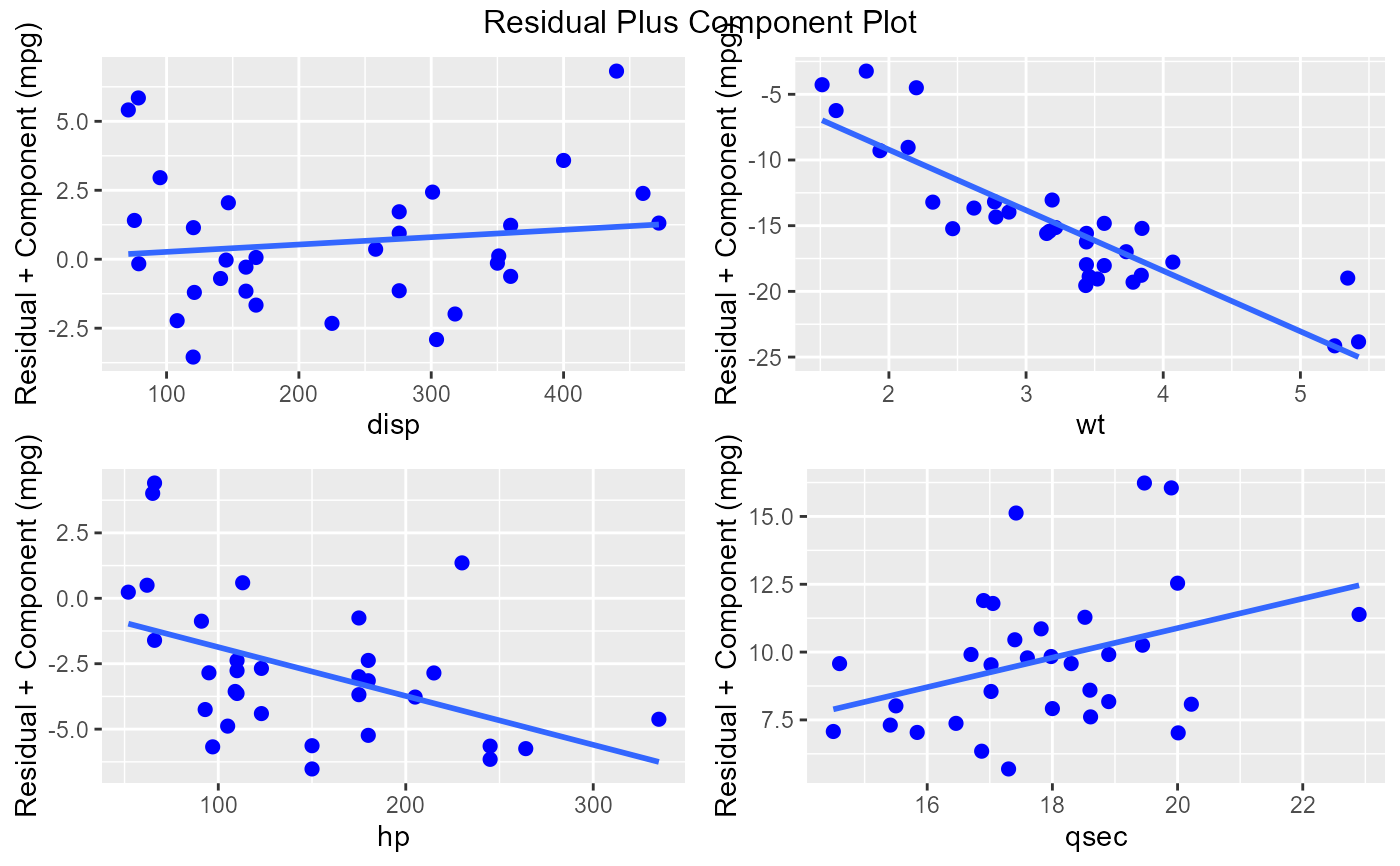
ols_plot_comp_plus_resid.RdThe residual plus component plot indicates whether any non-linearity is present in the relationship between response and predictor variables and can suggest possible transformations for linearizing the data.
References
Chatterjee, Samprit and Hadi, Ali. Regression Analysis by Example. 5th ed. N.p.: John Wiley & Sons, 2012. Print.
Kutner, MH, Nachtscheim CJ, Neter J and Li W., 2004, Applied Linear Statistical Models (5th edition). Chicago, IL., McGraw Hill/Irwin.
Examples
model <- lm(mpg ~ disp + hp + wt + qsec, data = mtcars)
ols_plot_comp_plus_resid(model)
#> `geom_smooth()` using formula = 'y ~ x'
#> `geom_smooth()` using formula = 'y ~ x'
#> `geom_smooth()` using formula = 'y ~ x'
#> `geom_smooth()` using formula = 'y ~ x'