Chart of cook's distance to detect observations that strongly influence fitted values of the model.
Value
ols_plot_cooksd_chart returns a list containing the
following components:
- outliers
a
data.framewith observation number andcooks distancethat exceedthreshold- threshold
thresholdfor classifying an observation as an outlier
Details
Cook's distance was introduced by American statistician R Dennis Cook in 1977. It is used to identify influential data points. It depends on both the residual and leverage i.e it takes it account both the x value and y value of the observation.
Steps to compute Cook's distance:
Delete observations one at a time.
Refit the regression model on remaining \(n - 1\) observations
exmine how much all of the fitted values change when the ith observation is deleted.
A data point having a large cook's d indicates that the data point strongly influences the fitted values. There are several methods/formulas to compute the threshold used for detecting or classifying observations as outliers and we list them below.
Type 1 : 4 / n
Type 2 : 4 / (n - k - 1)
Type 3 : ~1
Type 4 : 1 / (n - k - 1)
Type 5 : 3 * mean(Vector of cook's distance values)
where n and k stand for
n: Number of observations
k: Number of predictors
Examples
model <- lm(mpg ~ disp + hp + wt, data = mtcars)
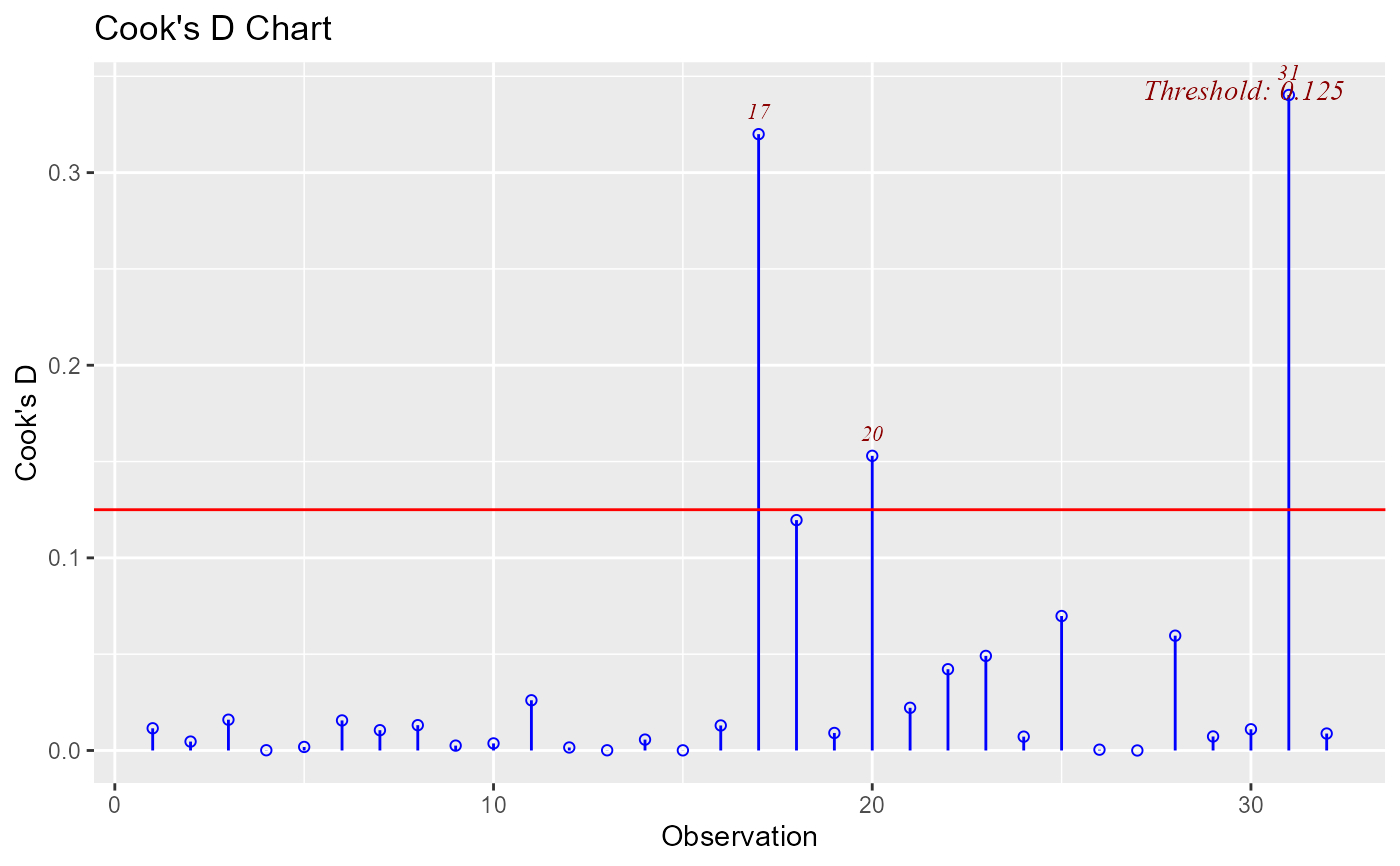
ols_plot_cooksd_chart(model)
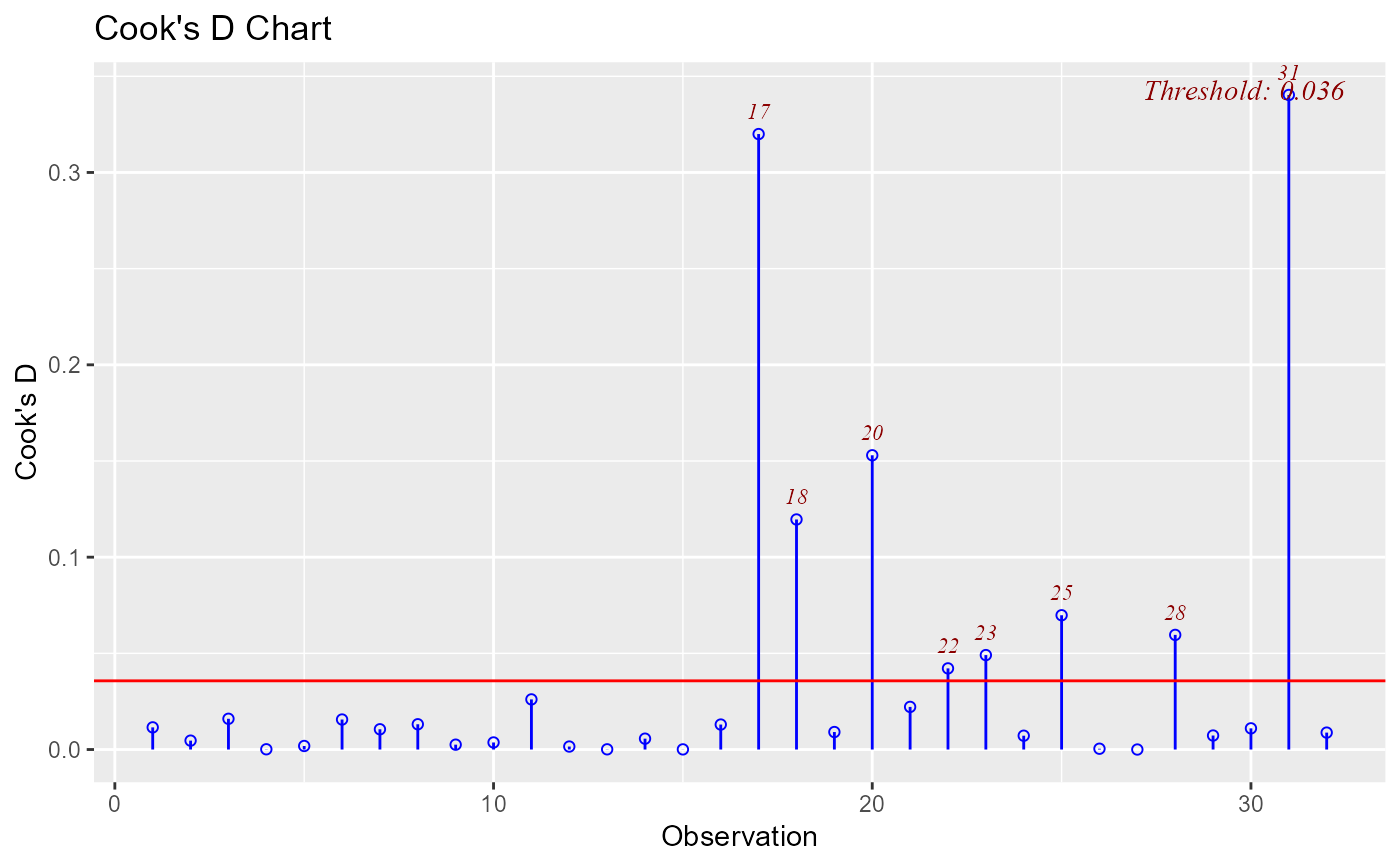
 ols_plot_cooksd_chart(model, type = 4)
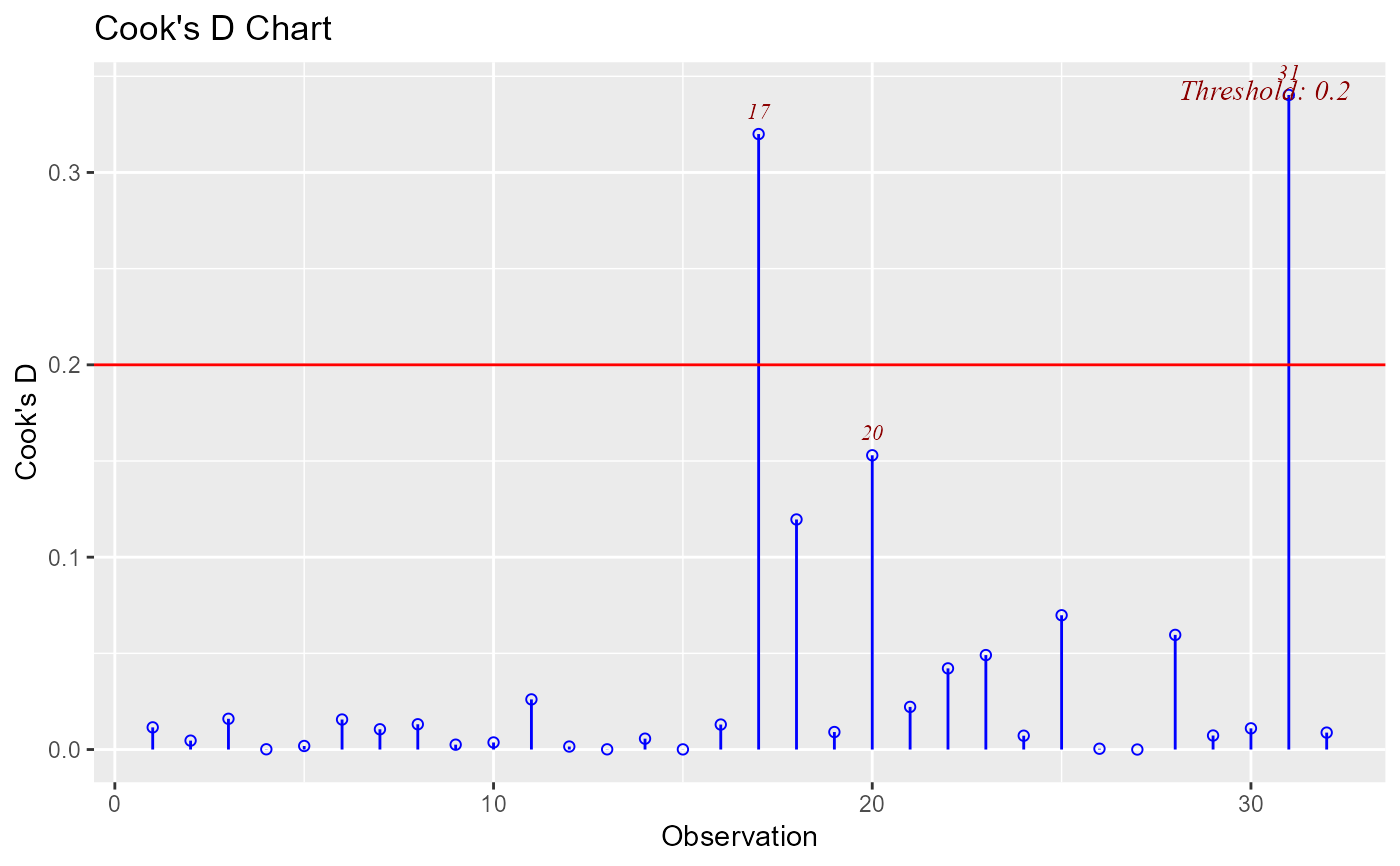
 ols_plot_cooksd_chart(model, threshold = 0.2)