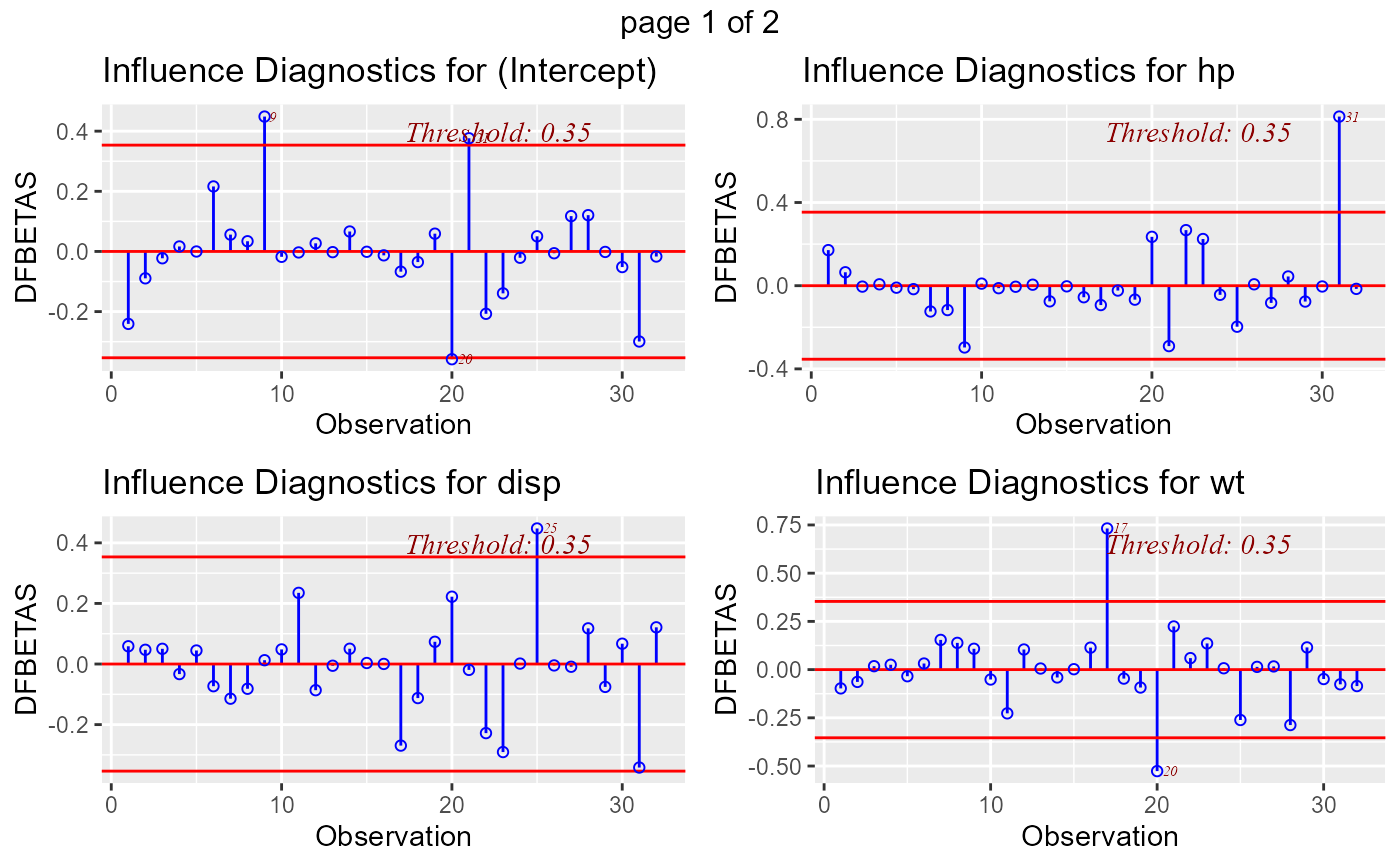
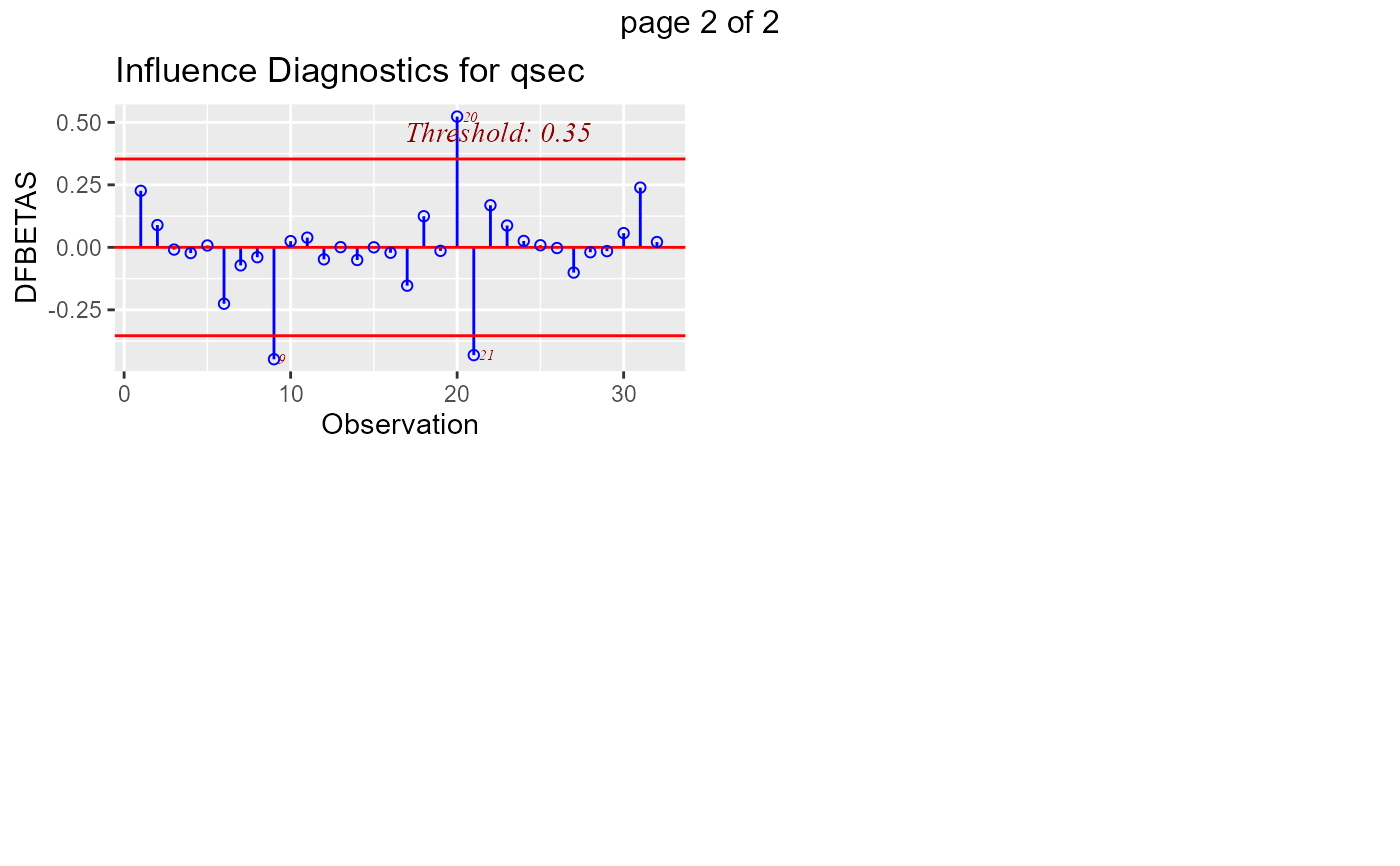
Panel of plots to detect influential observations using DFBETAs.
Value
list; ols_plot_dfbetas returns a list of data.frame (for intercept and each predictor)
with the observation number and DFBETA of observations that exceed the threshold for classifying
an observation as an outlier/influential observation.
Details
DFBETA measures the difference in each parameter estimate with and without the influential point. There is a DFBETA for each data point i.e if there are n observations and k variables, there will be \(n * k\) DFBETAs. In general, large values of DFBETAS indicate observations that are influential in estimating a given parameter. Belsley, Kuh, and Welsch recommend 2 as a general cutoff value to indicate influential observations and \(2/\sqrt(n)\) as a size-adjusted cutoff.
References
Belsley, David A.; Kuh, Edwin; Welsh, Roy E. (1980). Regression Diagnostics: Identifying Influential Data and Sources of Collinearity.
Wiley Series in Probability and Mathematical Statistics. New York: John Wiley & Sons. pp. ISBN 0-471-05856-4.
Examples
model <- lm(mpg ~ disp + hp + wt + qsec, data = mtcars)
ols_plot_dfbetas(model)