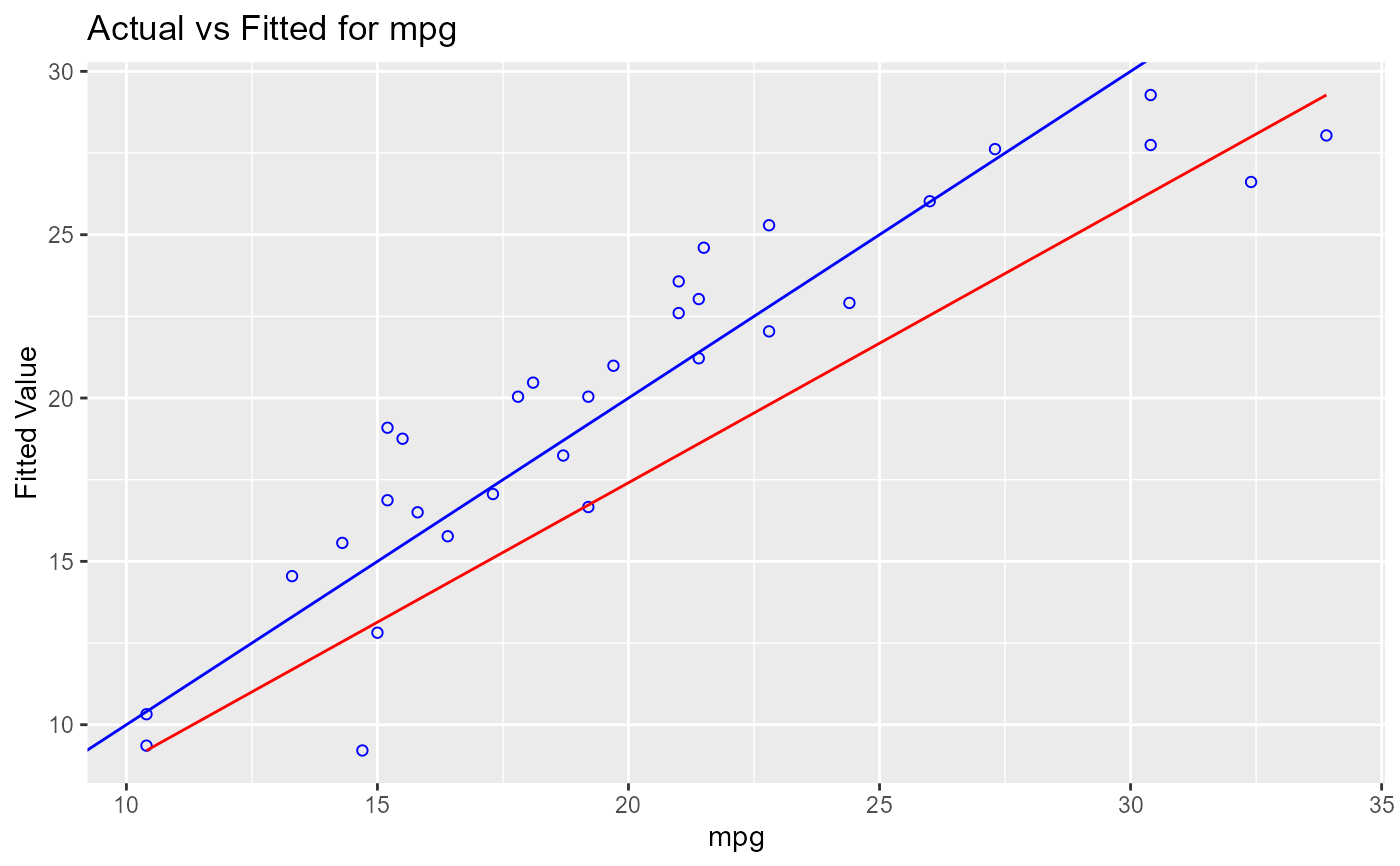
Plot of observed vs fitted values to assess the fit of the model.
Details
Ideally, all your points should be close to a regressed diagonal line. Draw such a diagonal line within your graph and check out where the points lie. If your model had a high R Square, all the points would be close to this diagonal line. The lower the R Square, the weaker the Goodness of fit of your model, the more foggy or dispersed your points are from this diagonal line.
Examples
model <- lm(mpg ~ disp + hp + wt, data = mtcars)
ols_plot_obs_fit(model)