Plot to detect non-linearity, influential observations and outliers.
Usage
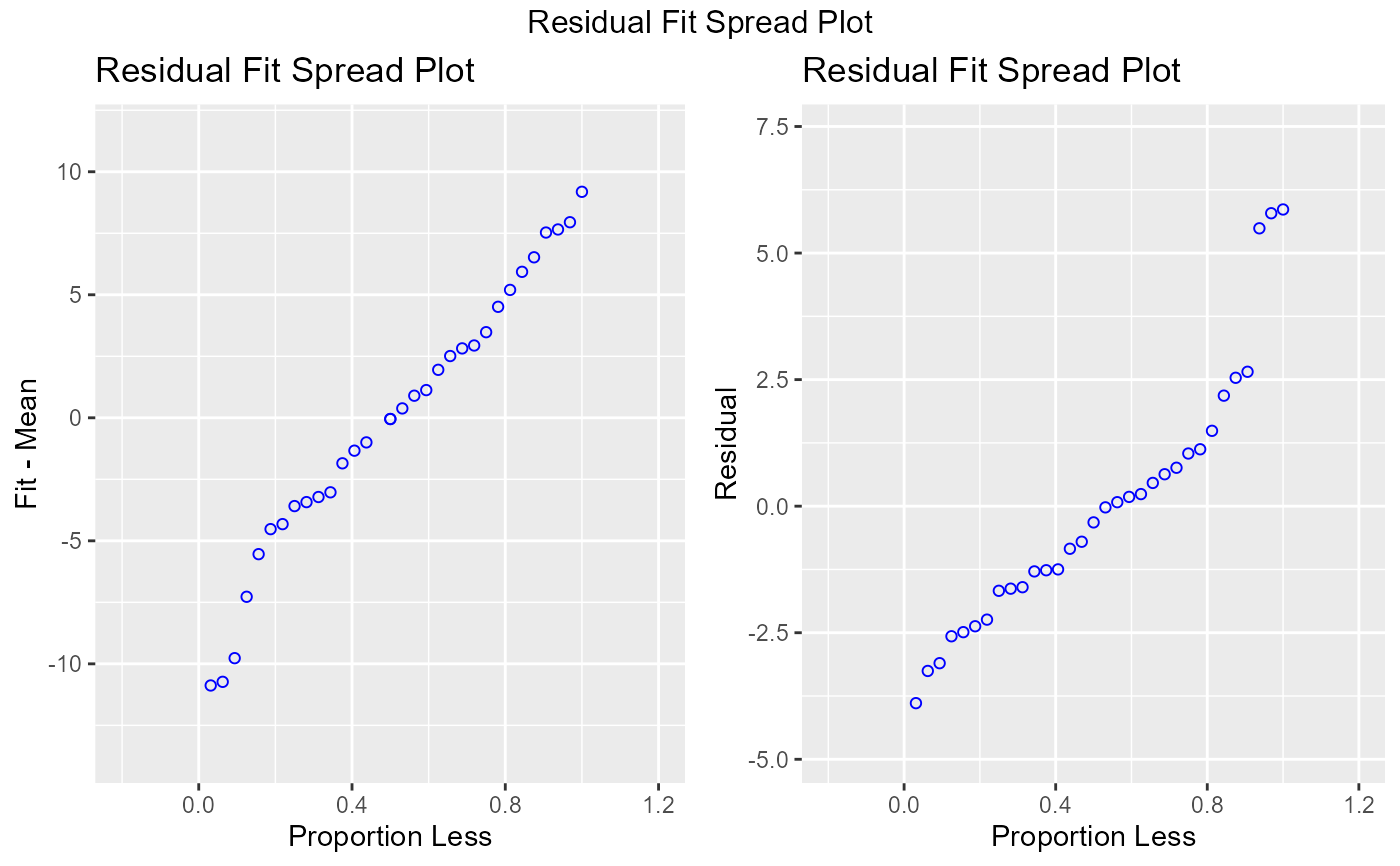
ols_plot_resid_fit_spread(model, print_plot = TRUE)
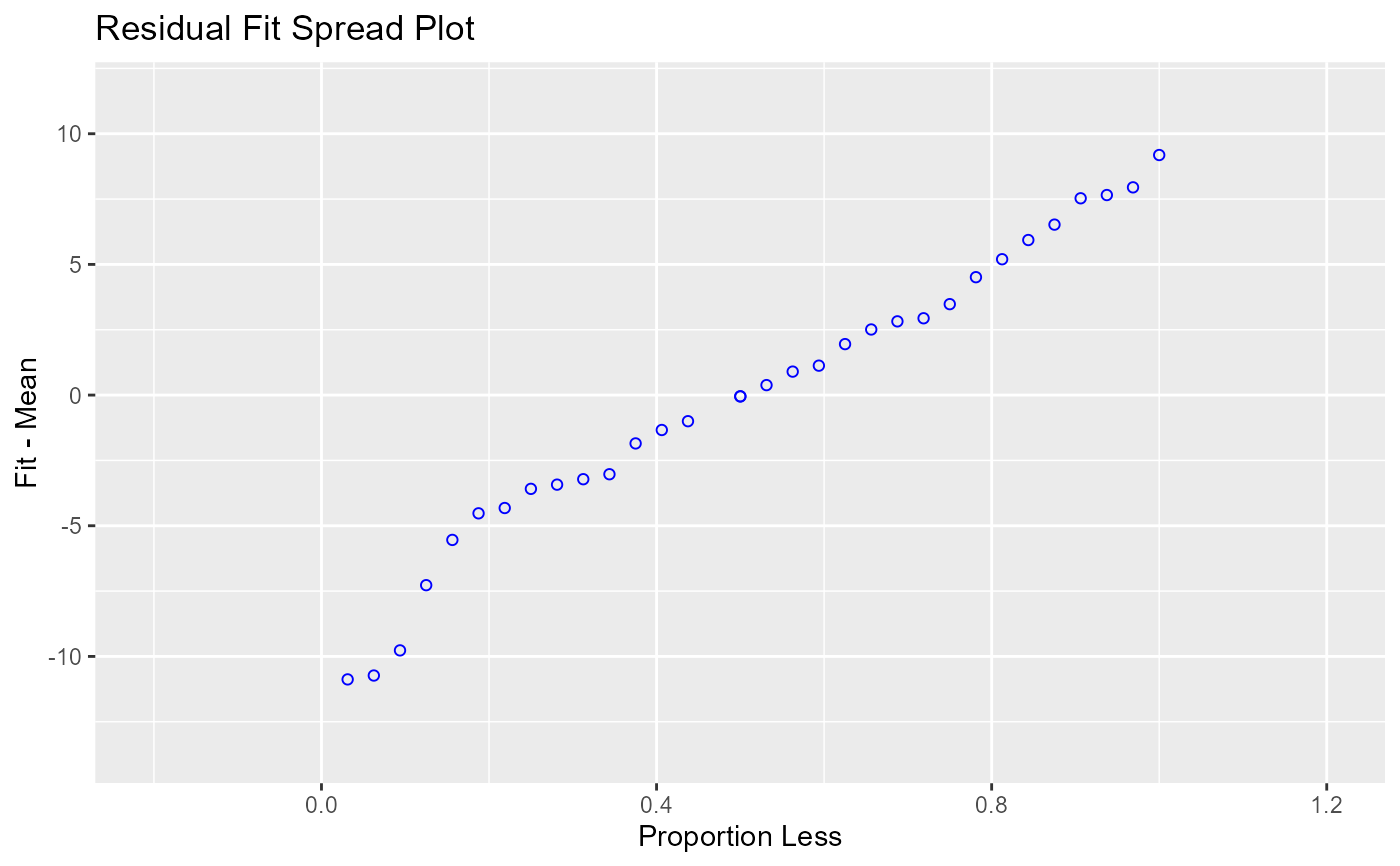
ols_plot_fm(model, print_plot = TRUE)
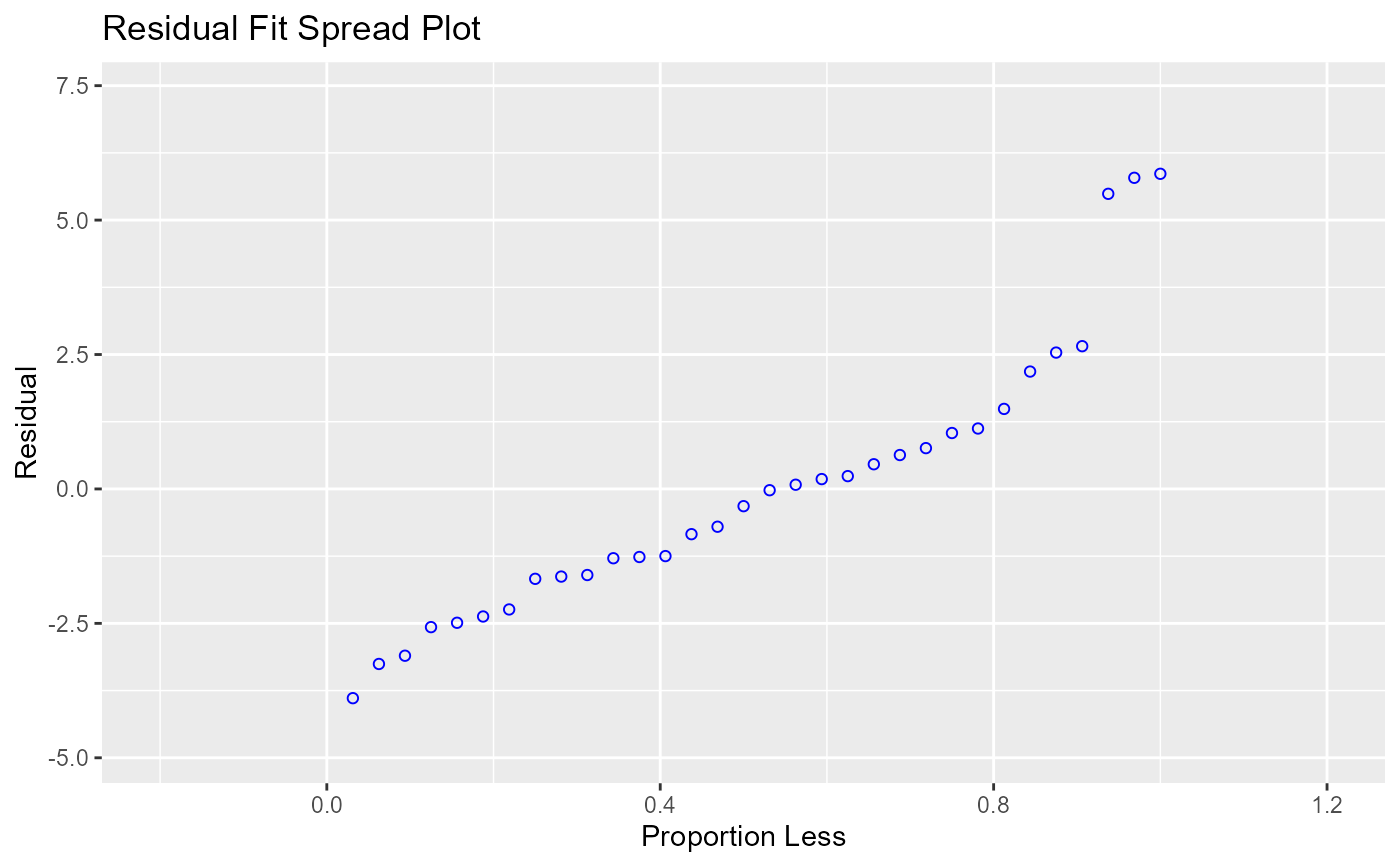
ols_plot_resid_spread(model, print_plot = TRUE)Details
Consists of side-by-side quantile plots of the centered fit and the residuals. It shows how much variation in the data is explained by the fit and how much remains in the residuals. For inappropriate models, the spread of the residuals in such a plot is often greater than the spread of the centered fit.
Examples
# model
model <- lm(mpg ~ disp + hp + wt, data = mtcars)
# residual fit spread plot
ols_plot_resid_fit_spread(model)
 # fit mean plot
ols_plot_fm(model)
# fit mean plot
ols_plot_fm(model)
 # residual spread plot
ols_plot_resid_spread(model)
# residual spread plot
ols_plot_resid_spread(model)