Graph for detecting outliers and/or observations with high leverage.
See also
ols_plot_resid_stud_fit(), ols_plot_resid_lev()
Examples
model <- lm(read ~ write + math + science, data = hsb)
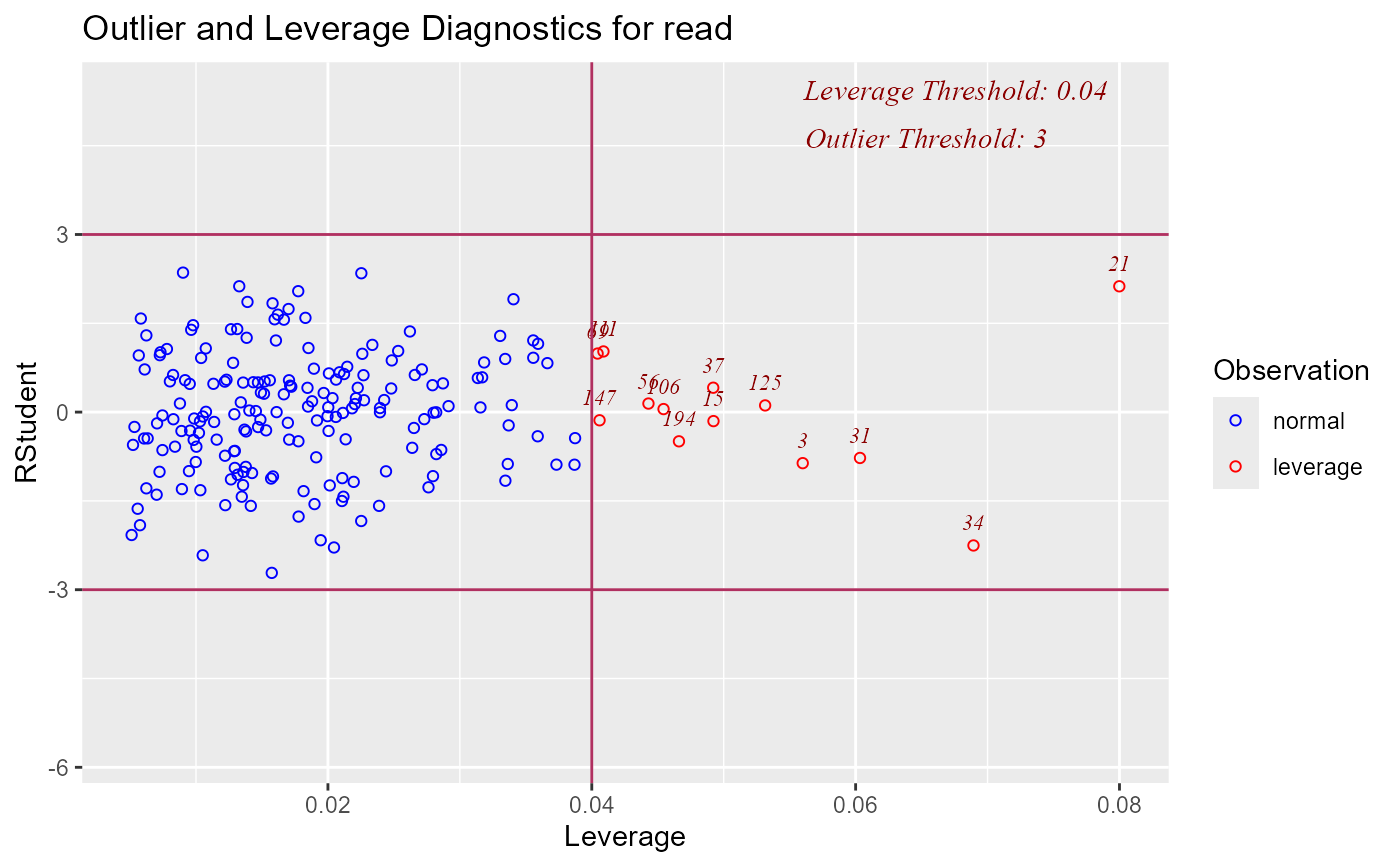
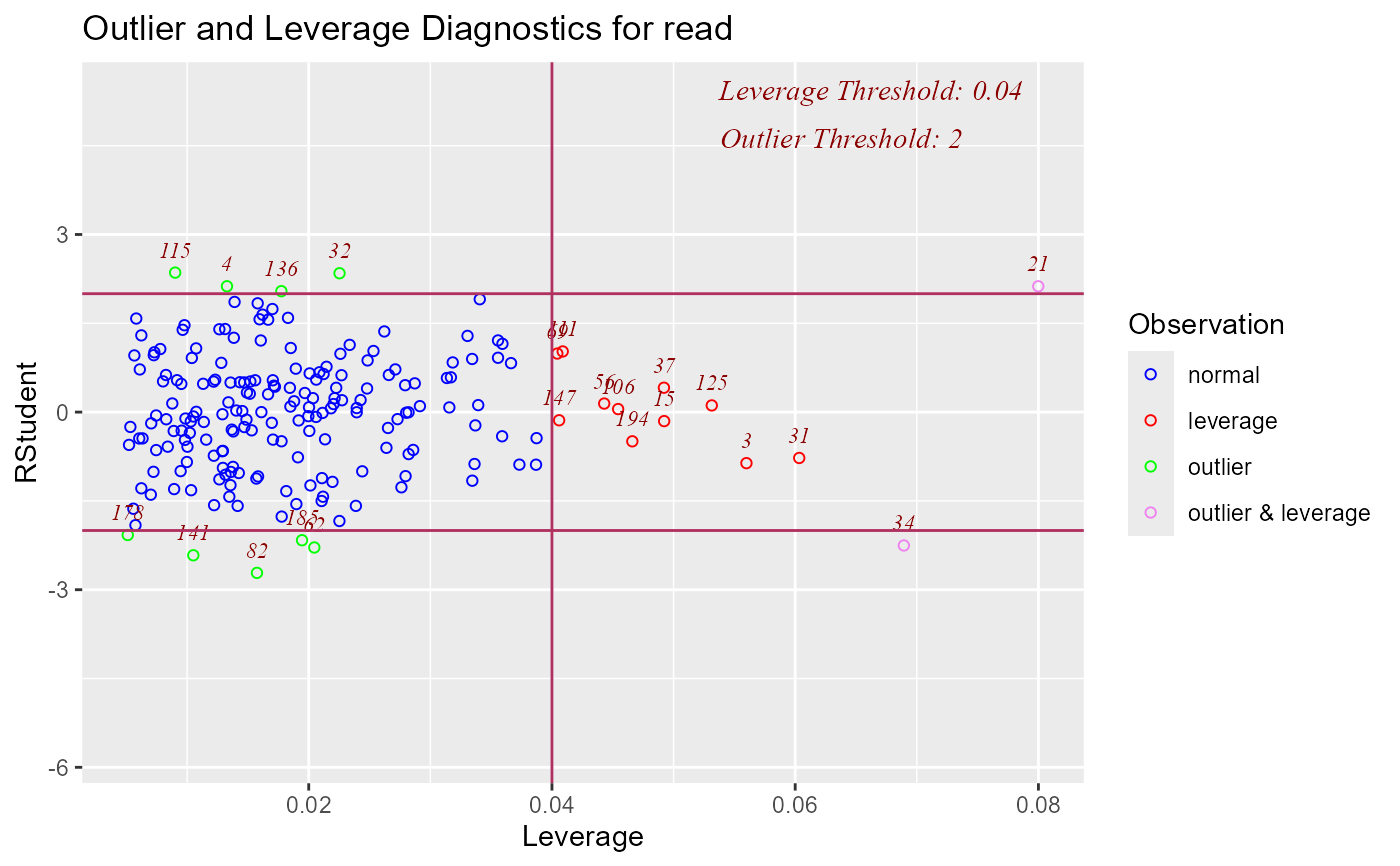
ols_plot_resid_lev(model)
 ols_plot_resid_lev(model, threshold = 3)