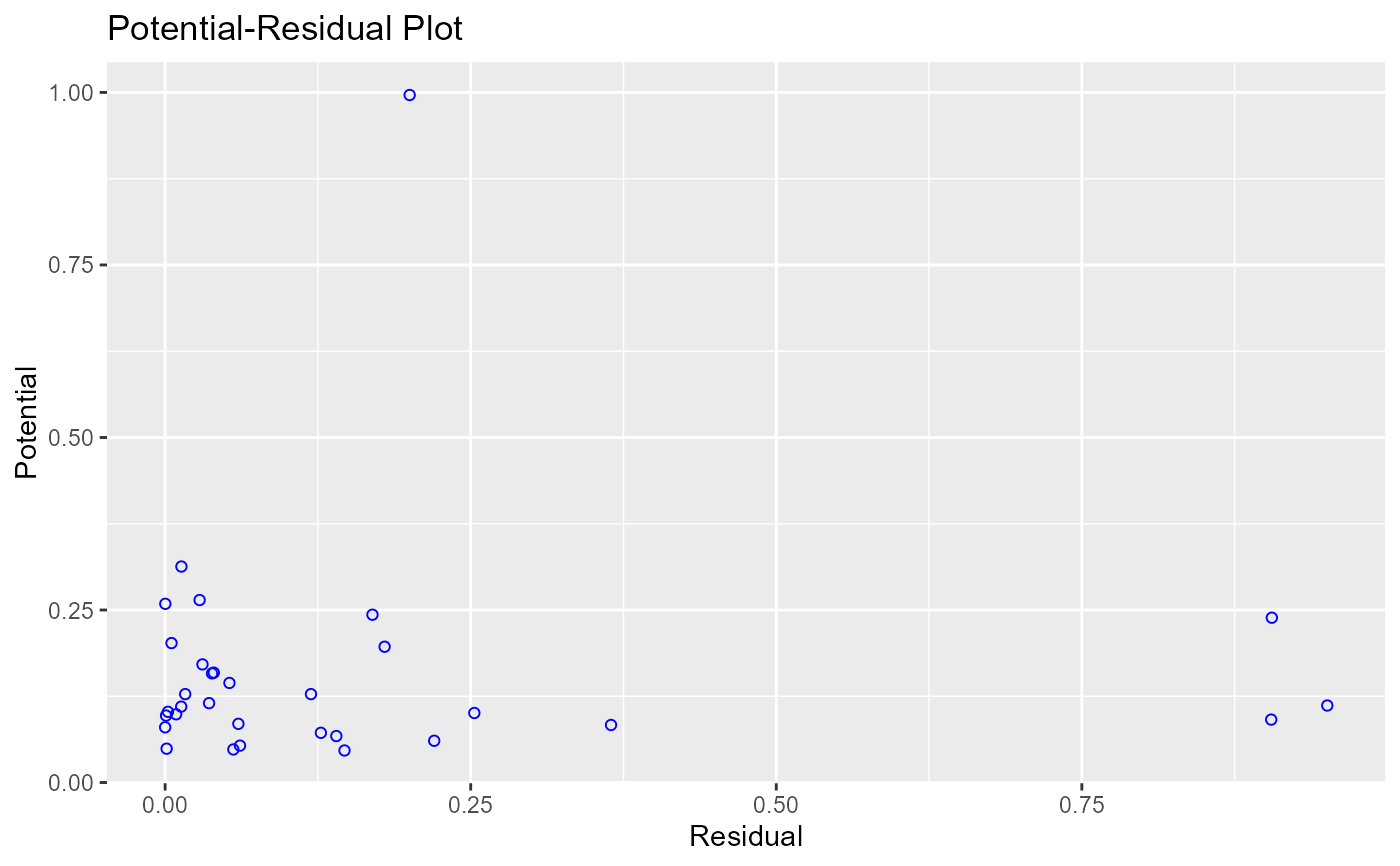
Plot to aid in classifying unusual observations as high-leverage points, outliers, or a combination of both.
References
Chatterjee, Samprit and Hadi, Ali. Regression Analysis by Example. 5th ed. N.p.: John Wiley & Sons, 2012. Print.
Examples
model <- lm(mpg ~ disp + hp + wt, data = mtcars)
ols_plot_resid_pot(model)