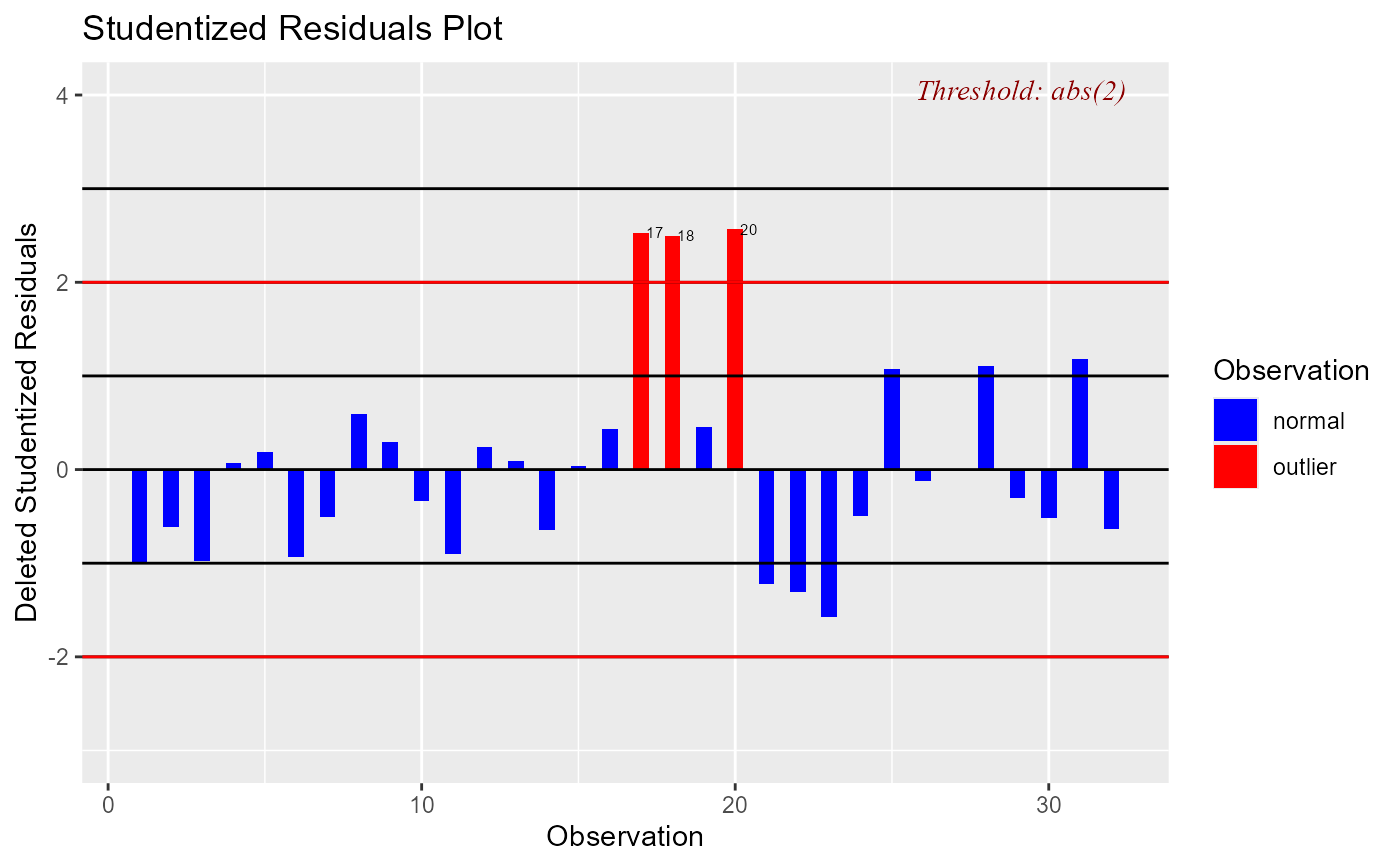
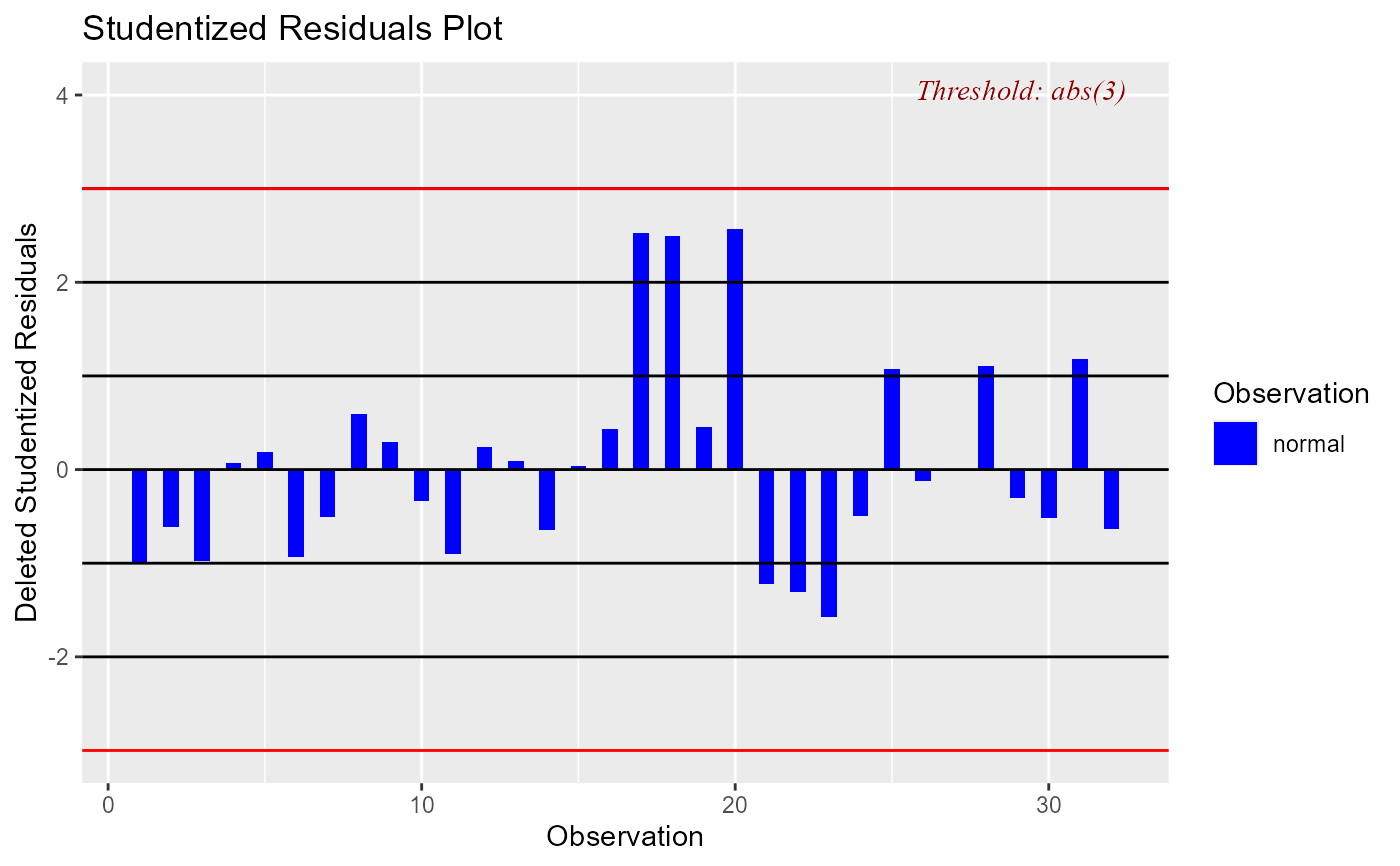
Graph for identifying outliers.
Value
ols_plot_resid_stud returns a list containing the
following components:
- outliers
a
data.framewith observation number andstudentized residualsthat exceedthreshold
for classifying an observation as an outlier
- threshold
thresholdfor classifying an observation as an outlier
Details
Studentized deleted residuals (or externally studentized residuals) is the deleted residual divided by its estimated standard deviation. Studentized residuals are going to be more effective for detecting outlying Y observations than standardized residuals. If an observation has an externally studentized residual that is larger than 3 (in absolute value) we can call it an outlier.
Examples
model <- lm(mpg ~ disp + hp + wt, data = mtcars)
ols_plot_resid_stud(model)

ols_plot_resid_stud(model, threshold = 2)