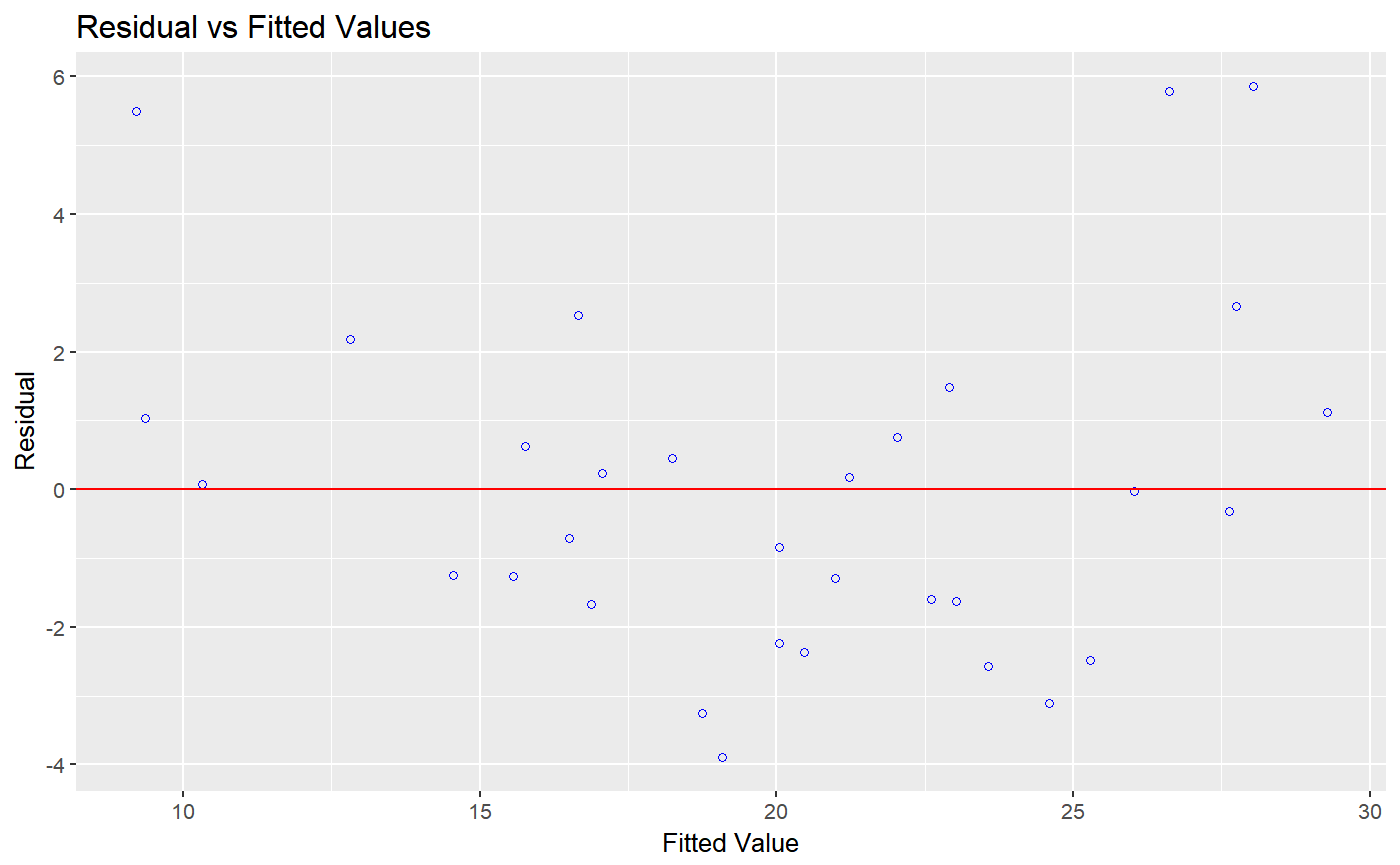
Residual vs fitted plot
Scatter plot of residuals on the y axis and fitted values on the x axis to detect non-linearity, unequal error variances, and outliers.
ols_rvsp_plot(model)
Arguments
| model | An object of class |
|---|
Details
Characteristics of a well behaved residual vs fitted plot:
The residuals spread randomly around the 0 line indicating that the relationship is linear.
The residuals form an approximate horizontal band around the 0 line indicating homogeneity of error variance.
No one residual is visibly away from the random pattern of the residuals indicating that there are no outliers.
See also
Other residual diagnostics: ols_plot_resid_box,
ols_plot_resid_hist,
ols_plot_resid_qq,
ols_test_correlation,
ols_test_normality
Examples
model <- lm(mpg ~ disp + hp + wt, data = mtcars)
ols_rvsp_plot(model)