Residual vs regressors plot for shiny app
Source:R/ols-resid-vs-regressor-plot-shiny.R
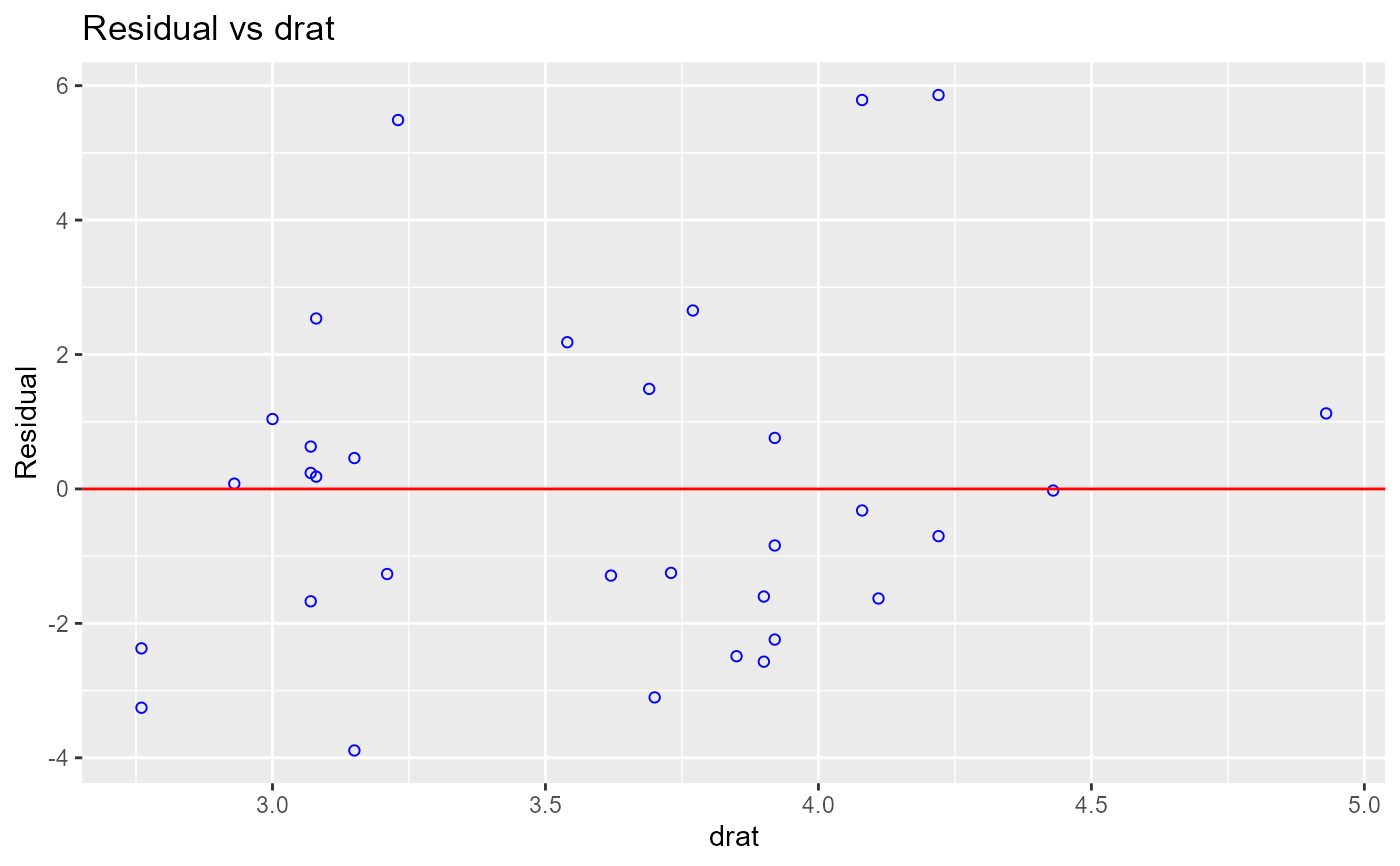
rvsr_plot_shiny.RdGraph to determine whether we should add a new predictor to the model already containing other predictors. The residuals from the model is regressed on the new predictor and if the plot shows non random pattern, you should consider adding the new predictor to the model.
Examples
model <- lm(mpg ~ disp + hp + wt, data = mtcars)
rvsr_plot_shiny(model, mtcars, 'drat')