Added variable plot provides information about the marginal importance of a predictor variable, given the other predictor variables already in the model. It shows the marginal importance of the variable in reducing the residual variability.
Details
The added variable plot was introduced by Mosteller and Tukey (1977). It enables us to visualize the regression coefficient of a new variable being considered to be included in a model. The plot can be constructed for each predictor variable.
Let us assume we want to test the effect of adding/removing variable X from a model. Let the response variable of the model be Y
Steps to construct an added variable plot:
Regress Y on all variables other than X and store the residuals (Y residuals).
Regress X on all the other variables included in the model (X residuals).
Construct a scatter plot of Y residuals and X residuals.
What do the Y and X residuals represent? The Y residuals represent the part of Y not explained by all the variables other than X. The X residuals represent the part of X not explained by other variables. The slope of the line fitted to the points in the added variable plot is equal to the regression coefficient when Y is regressed on all variables including X.
A strong linear relationship in the added variable plot indicates the increased importance of the contribution of X to the model already containing the other predictors.
References
Chatterjee, Samprit and Hadi, Ali. Regression Analysis by Example. 5th ed. N.p.: John Wiley & Sons, 2012. Print.
Kutner, MH, Nachtscheim CJ, Neter J and Li W., 2004, Applied Linear Statistical Models (5th edition). Chicago, IL., McGraw Hill/Irwin.
Examples
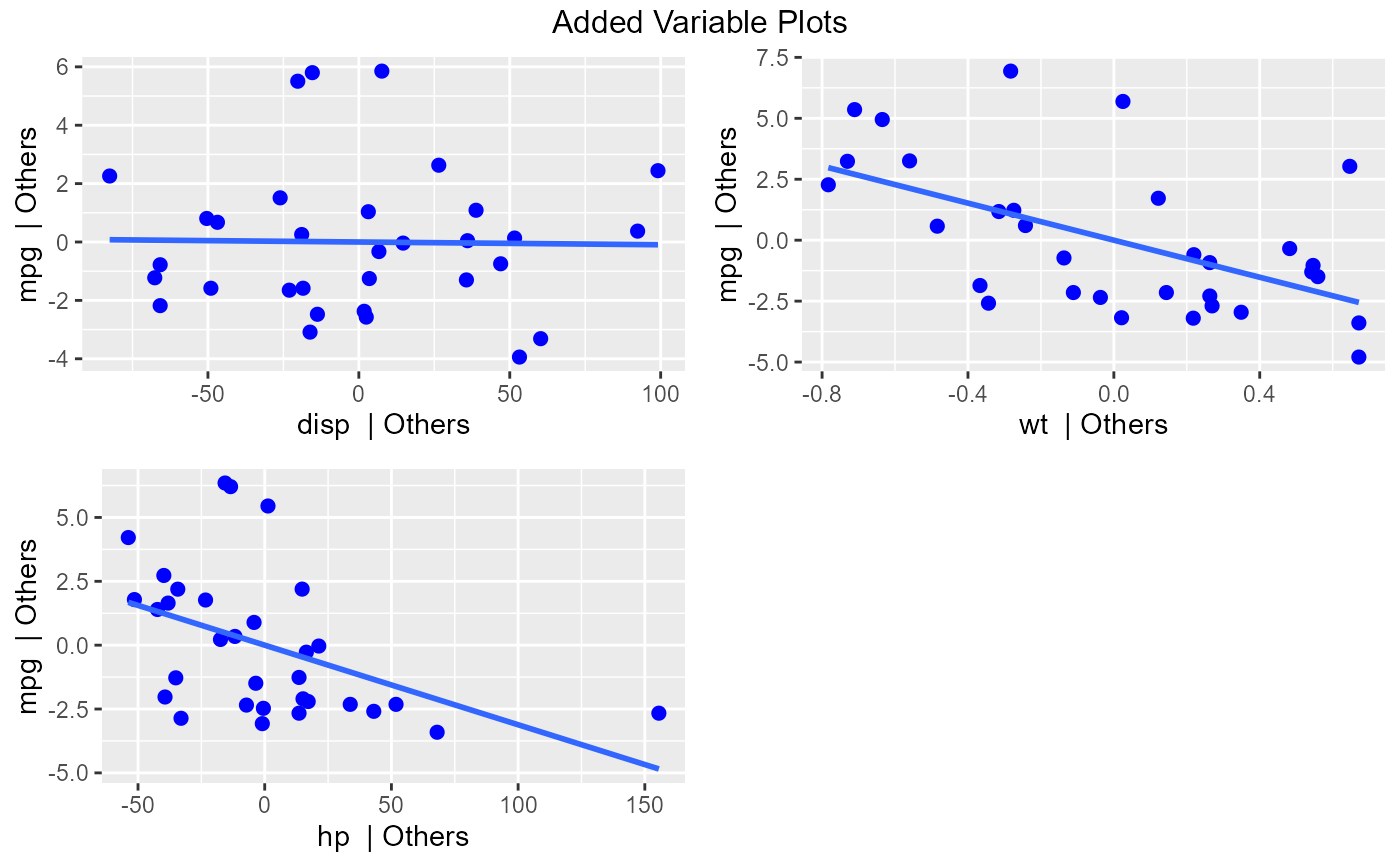
model <- lm(mpg ~ disp + hp + wt, data = mtcars)
ols_plot_added_variable(model)
#> `geom_smooth()` using formula = 'y ~ x'
#> `geom_smooth()` using formula = 'y ~ x'
#> `geom_smooth()` using formula = 'y ~ x'