Introduction
Variable selection refers to the process of choosing the most relevant variables to include in a regression model. They help to improve model performance and avoid over fitting.
Before we explore stepwise selection methods, let us take a quick look at all/best subset regression. As they evaluate every possible variable combination, these methods are computationally intensive and may crash your system if used with a large set of variables. We have included them in the package purely for educational purpose.
All Possible Regression
All subset regression tests all possible subsets of the set of potential independent variables. If there are K potential independent variables (besides the constant), then there are distinct subsets of them to be tested. For example, if you have 10 candidate independent variables, the number of subsets to be tested is , which is 1024, and if you have 20 candidate variables, the number is , which is more than one million.
model <- lm(mpg ~ disp + hp + wt + qsec, data = mtcars)
ols_step_all_possible(model)
## Index N Predictors R-Square Adj. R-Square Mallow's Cp
## 3 1 1 wt 0.7528328 0.7445939 12.480939
## 1 2 1 disp 0.7183433 0.7089548 18.129607
## 2 3 1 hp 0.6024373 0.5891853 37.112642
## 4 4 1 qsec 0.1752963 0.1478062 107.069616
## 8 5 2 hp wt 0.8267855 0.8148396 2.369005
## 10 6 2 wt qsec 0.8264161 0.8144448 2.429492
## 6 7 2 disp wt 0.7809306 0.7658223 9.879096
## 5 8 2 disp hp 0.7482402 0.7308774 15.233115
## 7 9 2 disp qsec 0.7215598 0.7023571 19.602810
## 9 10 2 hp qsec 0.6368769 0.6118339 33.472150
## 14 11 3 hp wt qsec 0.8347678 0.8170643 3.061665
## 11 12 3 disp hp wt 0.8268361 0.8082829 4.360702
## 13 13 3 disp wt qsec 0.8264170 0.8078189 4.429343
## 12 14 3 disp hp qsec 0.7541953 0.7278591 16.257790
## 15 15 4 disp hp wt qsec 0.8351443 0.8107212 5.000000Best Subset Regression
Select the subset of predictors that do the best at meeting some well-defined objective criterion, such as having the largest R2 value or the smallest MSE, Mallow’s Cp or AIC.
model <- lm(mpg ~ disp + hp + wt + qsec, data = mtcars)
ols_step_best_subset(model)
## Best Subsets Regression
## ------------------------------
## Model Index Predictors
## ------------------------------
## 1 wt
## 2 hp wt
## 3 hp wt qsec
## 4 disp hp wt qsec
## ------------------------------
##
## Subsets Regression Summary
## ---------------------------------------------------------------------------------------------------------------------------------
## Adj. Pred
## Model R-Square R-Square R-Square C(p) AIC SBIC SBC MSEP FPE HSP APC
## ---------------------------------------------------------------------------------------------------------------------------------
## 1 0.7528 0.7446 0.7087 12.4809 166.0294 74.2916 170.4266 296.9167 9.8572 0.3199 0.2801
## 2 0.8268 0.8148 0.7811 2.3690 156.6523 66.5755 162.5153 215.5104 7.3563 0.2402 0.2091
## 3 0.8348 0.8171 0.782 3.0617 157.1426 67.7238 164.4713 213.1929 7.4756 0.2461 0.2124
## 4 0.8351 0.8107 0.771 5.0000 159.0696 70.0408 167.8640 220.8882 7.9497 0.2644 0.2259
## ---------------------------------------------------------------------------------------------------------------------------------
## AIC: Akaike Information Criteria
## SBIC: Sawa's Bayesian Information Criteria
## SBC: Schwarz Bayesian Criteria
## MSEP: Estimated error of prediction, assuming multivariate normality
## FPE: Final Prediction Error
## HSP: Hocking's Sp
## APC: Amemiya Prediction CriteriaStepwise Selection
Stepwise regression is a method of fitting regression models that involves the iterative selection of independent variables to use in a model. It can be achieved through forward selection, backward elimination, or a combination of both methods. The forward selection approach starts with no variables and adds each new variable incrementally, testing for statistical significance, while the backward elimination method begins with a full model and then removes the least statistically significant variables one at a time.
Model
We will use the below model throughout this article except in the case of hierarchical selection. You can learn more about the data here.
##
## Call:
## lm(formula = y ~ ., data = surgical)
##
## Residuals:
##     Min      1Q  Median      3Q     Max
## -285.36 -132.75  -10.00   89.48  790.12
##
## Coefficients:
##              Estimate Std. Error t value Pr(>|t|)
## (Intercept) -1148.823    242.328  -4.741 2.17e-05 ***
## bcs            62.390     24.470   2.550 0.014258 *
## pindex          8.973      1.874   4.788 1.86e-05 ***
## enzyme_test     9.888      1.742   5.677 9.39e-07 ***
## liver_test     50.413     44.959   1.121 0.268109
## age            -0.951      2.649  -0.359 0.721231
## gender         15.874     58.475   0.271 0.787269
## alc_mod         7.713     64.956   0.119 0.906007
## alc_heavy     320.697     85.070   3.770 0.000474 ***
## ---
## Signif. codes:  0 '***' 0.001 '**' 0.01 '*' 0.05 '.' 0.1 ' ' 1
##
## Residual standard error: 201.4 on 45 degrees of freedom
## Multiple R-squared:  0.7818, Adjusted R-squared:  0.7431
## F-statistic: 20.16 on 8 and 45 DF,  p-value: 1.607e-12
Model specification
Irrespective of the stepwise method being used, we have to specify
the full model i.e. all the variabels/predictors under consideration as
olsrr extracts the candidate variables for
selection/elimination from the model specified.
Forward selection
# stepwise forward regression
ols_step_forward_p(model)
##
##
## Stepwise Summary
## --------------------------------------------------------------------------
## Step Variable AIC SBC SBIC R2 Adj. R2
## --------------------------------------------------------------------------
## 0 Base Model 802.606 806.584 646.794 0.00000 0.00000
## 1 liver_test 771.875 777.842 616.009 0.45454 0.44405
## 2 alc_heavy 761.439 769.395 605.506 0.56674 0.54975
## 3 enzyme_test 750.509 760.454 595.297 0.65900 0.63854
## 4 pindex 735.715 747.649 582.943 0.75015 0.72975
## 5 bcs 730.620 744.543 579.638 0.78091 0.75808
## --------------------------------------------------------------------------
##
## Final Model Output
## ------------------
##
## Model Summary
## -------------------------------------------------------------------
## R 0.884 RMSE 184.276
## R-Squared 0.781 MSE 33957.712
## Adj. R-Squared 0.758 Coef. Var 27.839
## Pred R-Squared 0.700 AIC 730.620
## MAE 137.656 SBC 744.543
## -------------------------------------------------------------------
## RMSE: Root Mean Square Error
## MSE: Mean Square Error
## MAE: Mean Absolute Error
## AIC: Akaike Information Criteria
## SBC: Schwarz Bayesian Criteria
##
## ANOVA
## -----------------------------------------------------------------------
## Sum of
## Squares DF Mean Square F Sig.
## -----------------------------------------------------------------------
## Regression 6535804.090 5 1307160.818 34.217 0.0000
## Residual 1833716.447 48 38202.426
## Total 8369520.537 53
## -----------------------------------------------------------------------
##
## Parameter Estimates
## ------------------------------------------------------------------------------------------------
## model Beta Std. Error Std. Beta t Sig lower upper
## ------------------------------------------------------------------------------------------------
## (Intercept) -1178.330 208.682 -5.647 0.000 -1597.914 -758.746
## liver_test 58.064 40.144 0.156 1.446 0.155 -22.652 138.779
## alc_heavy 317.848 71.634 0.314 4.437 0.000 173.818 461.878
## enzyme_test 9.748 1.656 0.521 5.887 0.000 6.419 13.077
## pindex 8.924 1.808 0.380 4.935 0.000 5.288 12.559
## bcs 59.864 23.060 0.241 2.596 0.012 13.498 106.230
## ------------------------------------------------------------------------------------------------Backward elimination
# stepwise backward regression
ols_step_backward_p(model)
##
##
## Stepwise Summary
## -------------------------------------------------------------------------
## Step Variable AIC SBC SBIC R2 Adj. R2
## -------------------------------------------------------------------------
## 0 Full Model 736.390 756.280 586.665 0.78184 0.74305
## 1 alc_mod 734.407 752.308 584.276 0.78177 0.74856
## 2 gender 732.494 748.406 581.938 0.78142 0.75351
## 3 age 730.620 744.543 579.638 0.78091 0.75808
## -------------------------------------------------------------------------
##
## Final Model Output
## ------------------
##
## Model Summary
## -------------------------------------------------------------------
## R 0.884 RMSE 184.276
## R-Squared 0.781 MSE 33957.712
## Adj. R-Squared 0.758 Coef. Var 27.839
## Pred R-Squared 0.700 AIC 730.620
## MAE 137.656 SBC 744.543
## -------------------------------------------------------------------
## RMSE: Root Mean Square Error
## MSE: Mean Square Error
## MAE: Mean Absolute Error
## AIC: Akaike Information Criteria
## SBC: Schwarz Bayesian Criteria
##
## ANOVA
## -----------------------------------------------------------------------
## Sum of
## Squares DF Mean Square F Sig.
## -----------------------------------------------------------------------
## Regression 6535804.090 5 1307160.818 34.217 0.0000
## Residual 1833716.447 48 38202.426
## Total 8369520.537 53
## -----------------------------------------------------------------------
##
## Parameter Estimates
## ------------------------------------------------------------------------------------------------
## model Beta Std. Error Std. Beta t Sig lower upper
## ------------------------------------------------------------------------------------------------
## (Intercept) -1178.330 208.682 -5.647 0.000 -1597.914 -758.746
## bcs 59.864 23.060 0.241 2.596 0.012 13.498 106.230
## pindex 8.924 1.808 0.380 4.935 0.000 5.288 12.559
## enzyme_test 9.748 1.656 0.521 5.887 0.000 6.419 13.077
## liver_test 58.064 40.144 0.156 1.446 0.155 -22.652 138.779
## alc_heavy 317.848 71.634 0.314 4.437 0.000 173.818 461.878
## ------------------------------------------------------------------------------------------------Criteria
The criteria for selecting variables may be one of the following:
- p value
- akaike information criterion (aic)
- schwarz bayesian criterion (sbc)
- sawa bayesian criterion (sbic)
- r-square
- adjusted r-square
Include/exclude variables
We can force variables to be included or excluded from the model at all stages of variable selection. The variables may be specified either by name or position in the model specified.
By name
ols_step_forward_p(model, include = c("age", "alc_mod"))##
##
## Stepwise Summary
## ---------------------------------------------------------------------------
## Step Variable AIC SBC SBIC R2 Adj. R2
## ---------------------------------------------------------------------------
## 0 Base Model 804.340 812.295 645.675 0.04110 0.00350
## 1 age 803.834 809.801 646.572 0.01420 -0.00476
## 2 alc_mod 804.340 812.295 645.675 0.04110 0.00350
## 3 liver_test 772.922 782.867 615.246 0.48357 0.45258
## 4 enzyme_test 763.665 775.599 606.382 0.58074 0.54652
## 5 alc_heavy 754.332 768.255 598.224 0.66012 0.62471
## 6 pindex 739.680 755.592 587.108 0.75031 0.71843
## ---------------------------------------------------------------------------
##
## Final Model Output
## ------------------
##
## Model Summary
## -------------------------------------------------------------------
## R 0.866 RMSE 196.724
## R-Squared 0.750 MSE 38700.429
## Adj. R-Squared 0.718 Coef. Var 30.034
## Pred R-Squared 0.649 AIC 739.680
## MAE 146.418 SBC 755.592
## -------------------------------------------------------------------
## RMSE: Root Mean Square Error
## MSE: Mean Square Error
## MAE: Mean Absolute Error
## AIC: Akaike Information Criteria
## SBC: Schwarz Bayesian Criteria
##
## ANOVA
## -----------------------------------------------------------------------
## Sum of
## Squares DF Mean Square F Sig.
## -----------------------------------------------------------------------
## Regression 6279697.346 6 1046616.224 23.538 0.0000
## Residual 2089823.191 47 44464.323
## Total 8369520.537 53
## -----------------------------------------------------------------------
##
## Parameter Estimates
## -----------------------------------------------------------------------------------------------
## model Beta Std. Error Std. Beta t Sig lower upper
## -----------------------------------------------------------------------------------------------
## (Intercept) -814.092 213.222 -3.818 0.000 -1243.041 -385.144
## age 0.458 2.706 0.013 0.169 0.866 -4.985 5.902
## alc_mod 1.088 67.941 0.001 0.016 0.987 -135.591 137.768
## liver_test 126.675 33.832 0.341 3.744 0.000 58.613 194.737
## enzyme_test 7.523 1.543 0.402 4.874 0.000 4.418 10.628
## alc_heavy 361.751 87.140 0.357 4.151 0.000 186.448 537.053
## pindex 7.862 1.908 0.334 4.120 0.000 4.023 11.700
## -----------------------------------------------------------------------------------------------By index
ols_step_forward_p(model, include = c(5, 7))##
##
## Stepwise Summary
## ---------------------------------------------------------------------------
## Step Variable AIC SBC SBIC R2 Adj. R2
## ---------------------------------------------------------------------------
## 0 Base Model 804.340 812.295 645.675 0.04110 0.00350
## 1 age 803.834 809.801 646.572 0.01420 -0.00476
## 2 alc_mod 804.340 812.295 645.675 0.04110 0.00350
## 3 liver_test 772.922 782.867 615.246 0.48357 0.45258
## 4 enzyme_test 763.665 775.599 606.382 0.58074 0.54652
## 5 alc_heavy 754.332 768.255 598.224 0.66012 0.62471
## 6 pindex 739.680 755.592 587.108 0.75031 0.71843
## ---------------------------------------------------------------------------
##
## Final Model Output
## ------------------
##
## Model Summary
## -------------------------------------------------------------------
## R 0.866 RMSE 196.724
## R-Squared 0.750 MSE 38700.429
## Adj. R-Squared 0.718 Coef. Var 30.034
## Pred R-Squared 0.649 AIC 739.680
## MAE 146.418 SBC 755.592
## -------------------------------------------------------------------
## RMSE: Root Mean Square Error
## MSE: Mean Square Error
## MAE: Mean Absolute Error
## AIC: Akaike Information Criteria
## SBC: Schwarz Bayesian Criteria
##
## ANOVA
## -----------------------------------------------------------------------
## Sum of
## Squares DF Mean Square F Sig.
## -----------------------------------------------------------------------
## Regression 6279697.346 6 1046616.224 23.538 0.0000
## Residual 2089823.191 47 44464.323
## Total 8369520.537 53
## -----------------------------------------------------------------------
##
## Parameter Estimates
## -----------------------------------------------------------------------------------------------
## model Beta Std. Error Std. Beta t Sig lower upper
## -----------------------------------------------------------------------------------------------
## (Intercept) -814.092 213.222 -3.818 0.000 -1243.041 -385.144
## age 0.458 2.706 0.013 0.169 0.866 -4.985 5.902
## alc_mod 1.088 67.941 0.001 0.016 0.987 -135.591 137.768
## liver_test 126.675 33.832 0.341 3.744 0.000 58.613 194.737
## enzyme_test 7.523 1.543 0.402 4.874 0.000 4.418 10.628
## alc_heavy 361.751 87.140 0.357 4.151 0.000 186.448 537.053
## pindex 7.862 1.908 0.334 4.120 0.000 4.023 11.700
## -----------------------------------------------------------------------------------------------Standardized output
All stepwise selection methods display standard output which includes:
- selection summary
- model summary
- ANOVA
- parameter estimates
# adjusted r-square
ols_step_forward_adj_r2(model)
##
##
## Stepwise Summary
## --------------------------------------------------------------------------
## Step Variable AIC SBC SBIC R2 Adj. R2
## --------------------------------------------------------------------------
## 0 Base Model 802.606 806.584 646.794 0.00000 0.00000
## 1 liver_test 771.875 777.842 616.009 0.45454 0.44405
## 2 alc_heavy 761.439 769.395 605.506 0.56674 0.54975
## 3 enzyme_test 750.509 760.454 595.297 0.65900 0.63854
## 4 pindex 735.715 747.649 582.943 0.75015 0.72975
## 5 bcs 730.620 744.543 579.638 0.78091 0.75808
## --------------------------------------------------------------------------
##
## Final Model Output
## ------------------
##
## Model Summary
## -------------------------------------------------------------------
## R 0.884 RMSE 184.276
## R-Squared 0.781 MSE 33957.712
## Adj. R-Squared 0.758 Coef. Var 27.839
## Pred R-Squared 0.700 AIC 730.620
## MAE 137.656 SBC 744.543
## -------------------------------------------------------------------
## RMSE: Root Mean Square Error
## MSE: Mean Square Error
## MAE: Mean Absolute Error
## AIC: Akaike Information Criteria
## SBC: Schwarz Bayesian Criteria
##
## ANOVA
## -----------------------------------------------------------------------
## Sum of
## Squares DF Mean Square F Sig.
## -----------------------------------------------------------------------
## Regression 6535804.090 5 1307160.818 34.217 0.0000
## Residual 1833716.447 48 38202.426
## Total 8369520.537 53
## -----------------------------------------------------------------------
##
## Parameter Estimates
## ------------------------------------------------------------------------------------------------
## model Beta Std. Error Std. Beta t Sig lower upper
## ------------------------------------------------------------------------------------------------
## (Intercept) -1178.330 208.682 -5.647 0.000 -1597.914 -758.746
## liver_test 58.064 40.144 0.156 1.446 0.155 -22.652 138.779
## alc_heavy 317.848 71.634 0.314 4.437 0.000 173.818 461.878
## enzyme_test 9.748 1.656 0.521 5.887 0.000 6.419 13.077
## pindex 8.924 1.808 0.380 4.935 0.000 5.288 12.559
## bcs 59.864 23.060 0.241 2.596 0.012 13.498 106.230
## ------------------------------------------------------------------------------------------------Visualization
Use the plot() method to visualize variable selection.
It will display how the variable selection criteria changes at each step
of the selection process along with the variable selected.
# adjusted r-square
k <- ols_step_forward_adj_r2(model)
plot(k)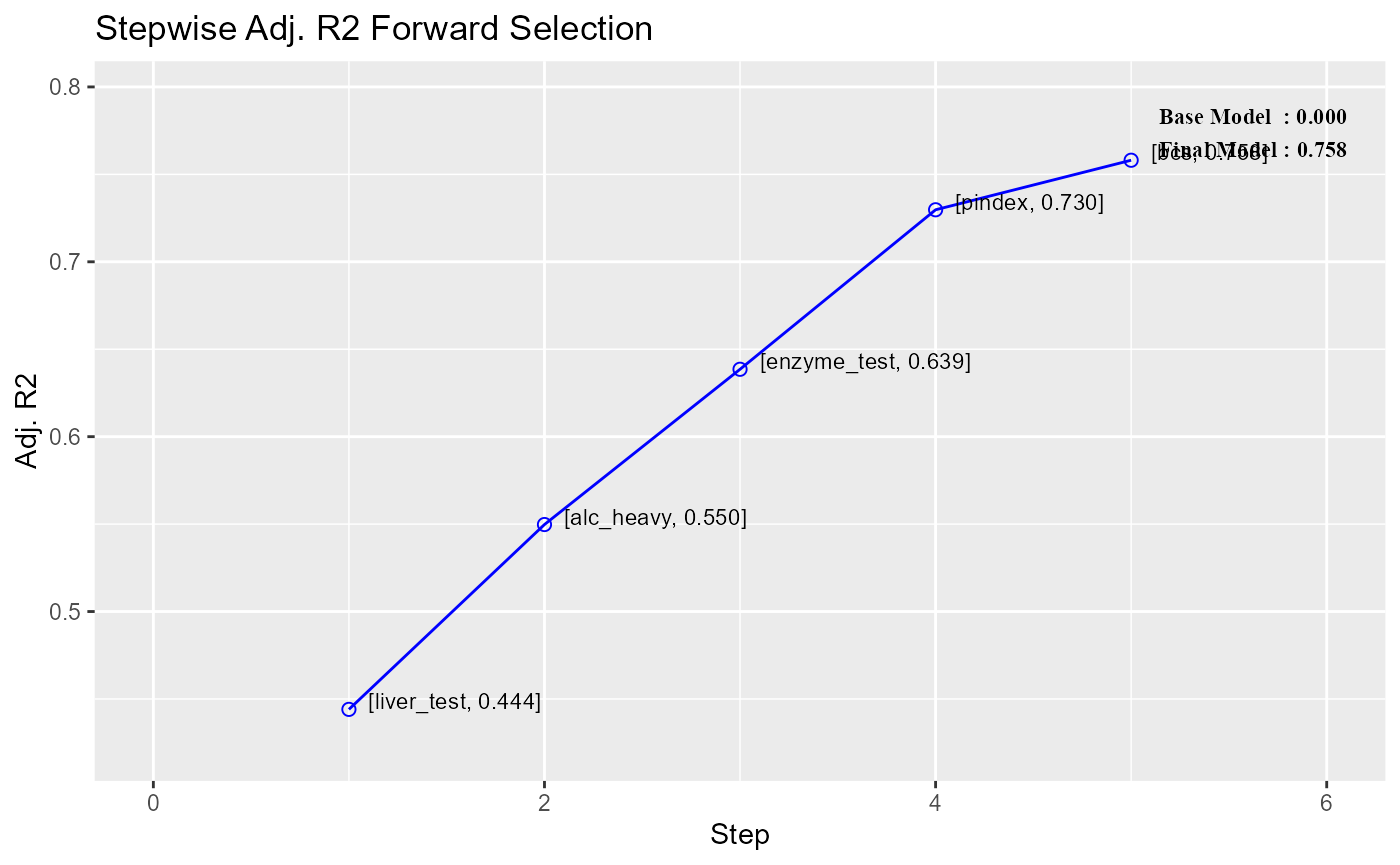
Verbose output
To view the detailed regression output at each stage of variable
selection/elimination, set details to TRUE. It
will display the following information at each step:
- step number
- variable selected/eliminated
- model
- value of the criteria at that stage
# adjusted r-square
ols_step_forward_adj_r2(model, details = TRUE)
## Forward Selection Method
## ------------------------
##
## Candidate Terms:
##
## 1. bcs
## 2. pindex
## 3. enzyme_test
## 4. liver_test
## 5. age
## 6. gender
## 7. alc_mod
## 8. alc_heavy
##
##
## Step => 0
## Model => y ~ 1
## Adj. R2 => 0
##
## Initiating stepwise selection...
##
## Table: Adding New Variables
## -------------------------------------------------------------------------
## Predictor DF AIC SBC SBIC R2 Adj. R2
## -------------------------------------------------------------------------
## liver_test 1 771.875 777.842 616.009 0.45454 0.44405
## enzyme_test 1 782.629 788.596 626.220 0.33435 0.32154
## pindex 1 794.100 800.067 637.196 0.17680 0.16097
## alc_heavy 1 794.301 800.268 637.389 0.17373 0.15784
## bcs 1 797.697 803.664 640.655 0.12010 0.10318
## alc_mod 1 802.828 808.795 645.601 0.03239 0.01378
## gender 1 802.956 808.923 645.725 0.03009 0.01143
## age 1 803.834 809.801 646.572 0.01420 -0.00476
## -------------------------------------------------------------------------
##
## Step => 1
## Added => liver_test
## Model => y ~ liver_test
## Adj. R2 => 0.44405
##
## Table: Adding New Variables
## ------------------------------------------------------------------------
## Predictor DF AIC SBC SBIC R2 Adj. R2
## ------------------------------------------------------------------------
## alc_heavy 1 761.439 769.395 605.506 0.56674 0.54975
## enzyme_test 1 762.077 770.033 606.090 0.56159 0.54440
## pindex 1 770.387 778.343 613.737 0.48866 0.46861
## alc_mod 1 771.141 779.097 614.435 0.48147 0.46113
## gender 1 773.802 781.758 616.901 0.45528 0.43391
## age 1 773.831 781.787 616.928 0.45498 0.43361
## bcs 1 773.867 781.823 616.961 0.45462 0.43323
## ------------------------------------------------------------------------
##
## Step => 2
## Added => alc_heavy
## Model => y ~ liver_test + alc_heavy
## Adj. R2 => 0.54975
##
## Table: Adding New Variables
## ------------------------------------------------------------------------
## Predictor DF AIC SBC SBIC R2 Adj. R2
## ------------------------------------------------------------------------
## enzyme_test 1 750.509 760.454 595.297 0.65900 0.63854
## pindex 1 756.125 766.070 600.225 0.62163 0.59892
## bcs 1 763.063 773.008 606.379 0.56975 0.54394
## age 1 763.110 773.055 606.421 0.56938 0.54354
## alc_mod 1 763.428 773.373 606.704 0.56683 0.54084
## gender 1 763.433 773.378 606.709 0.56679 0.54080
## ------------------------------------------------------------------------
##
## Step => 3
## Added => enzyme_test
## Model => y ~ liver_test + alc_heavy + enzyme_test
## Adj. R2 => 0.63854
##
## Table: Adding New Variables
## ----------------------------------------------------------------------
## Predictor DF AIC SBC SBIC R2 Adj. R2
## ----------------------------------------------------------------------
## pindex 1 735.715 747.649 582.943 0.75015 0.72975
## bcs 1 750.782 762.716 595.377 0.66973 0.64277
## alc_mod 1 752.403 764.337 596.743 0.65967 0.63189
## age 1 752.416 764.350 596.755 0.65959 0.63180
## gender 1 752.509 764.443 596.833 0.65900 0.63116
## ----------------------------------------------------------------------
##
## Step => 4
## Added => pindex
## Model => y ~ liver_test + alc_heavy + enzyme_test + pindex
## Adj. R2 => 0.72975
##
## Table: Adding New Variables
## ----------------------------------------------------------------------
## Predictor DF AIC SBC SBIC R2 Adj. R2
## ----------------------------------------------------------------------
## bcs 1 730.620 744.543 579.638 0.78091 0.75808
## age 1 737.680 751.603 585.012 0.75030 0.72429
## gender 1 737.712 751.635 585.036 0.75016 0.72413
## alc_mod 1 737.713 751.636 585.037 0.75015 0.72413
## ----------------------------------------------------------------------
##
## Step => 5
## Added => bcs
## Model => y ~ liver_test + alc_heavy + enzyme_test + pindex + bcs
## Adj. R2 => 0.75808
##
## Table: Adding New Variables
## ----------------------------------------------------------------------
## Predictor DF AIC SBC SBIC R2 Adj. R2
## ----------------------------------------------------------------------
## age 1 732.494 748.406 581.938 0.78142 0.75351
## gender 1 732.551 748.463 581.978 0.78119 0.75325
## alc_mod 1 732.614 748.526 582.023 0.78093 0.75297
## ----------------------------------------------------------------------
##
##
## No more variables to be added.
##
## Variables Selected:
##
## => liver_test
## => alc_heavy
## => enzyme_test
## => pindex
## => bcs##
##
## Stepwise Summary
## --------------------------------------------------------------------------
## Step Variable AIC SBC SBIC R2 Adj. R2
## --------------------------------------------------------------------------
## 0 Base Model 802.606 806.584 646.794 0.00000 0.00000
## 1 liver_test 771.875 777.842 616.009 0.45454 0.44405
## 2 alc_heavy 761.439 769.395 605.506 0.56674 0.54975
## 3 enzyme_test 750.509 760.454 595.297 0.65900 0.63854
## 4 pindex 735.715 747.649 582.943 0.75015 0.72975
## 5 bcs 730.620 744.543 579.638 0.78091 0.75808
## --------------------------------------------------------------------------
##
## Final Model Output
## ------------------
##
## Model Summary
## -------------------------------------------------------------------
## R 0.884 RMSE 184.276
## R-Squared 0.781 MSE 33957.712
## Adj. R-Squared 0.758 Coef. Var 27.839
## Pred R-Squared 0.700 AIC 730.620
## MAE 137.656 SBC 744.543
## -------------------------------------------------------------------
## RMSE: Root Mean Square Error
## MSE: Mean Square Error
## MAE: Mean Absolute Error
## AIC: Akaike Information Criteria
## SBC: Schwarz Bayesian Criteria
##
## ANOVA
## -----------------------------------------------------------------------
## Sum of
## Squares DF Mean Square F Sig.
## -----------------------------------------------------------------------
## Regression 6535804.090 5 1307160.818 34.217 0.0000
## Residual 1833716.447 48 38202.426
## Total 8369520.537 53
## -----------------------------------------------------------------------
##
## Parameter Estimates
## ------------------------------------------------------------------------------------------------
## model Beta Std. Error Std. Beta t Sig lower upper
## ------------------------------------------------------------------------------------------------
## (Intercept) -1178.330 208.682 -5.647 0.000 -1597.914 -758.746
## liver_test 58.064 40.144 0.156 1.446 0.155 -22.652 138.779
## alc_heavy 317.848 71.634 0.314 4.437 0.000 173.818 461.878
## enzyme_test 9.748 1.656 0.521 5.887 0.000 6.419 13.077
## pindex 8.924 1.808 0.380 4.935 0.000 5.288 12.559
## bcs 59.864 23.060 0.241 2.596 0.012 13.498 106.230
## ------------------------------------------------------------------------------------------------Progress
To view the progress in the variable selection procedure, set
progress to TRUE. It will display the variable
being selected/eliminated at each step until there are no more candidate
variables left.
# adjusted r-square
ols_step_forward_adj_r2(model, progress = TRUE)
## Forward Selection Method
## ------------------------
##
## Candidate Terms:
##
## 1. bcs
## 2. pindex
## 3. enzyme_test
## 4. liver_test
## 5. age
## 6. gender
## 7. alc_mod
## 8. alc_heavy
##
##
## Variables Entered:
##
## => liver_test
## => alc_heavy
## => enzyme_test
## => pindex
## => bcs
##
## No more variables to be added.##
##
## Stepwise Summary
## --------------------------------------------------------------------------
## Step Variable AIC SBC SBIC R2 Adj. R2
## --------------------------------------------------------------------------
## 0 Base Model 802.606 806.584 646.794 0.00000 0.00000
## 1 liver_test 771.875 777.842 616.009 0.45454 0.44405
## 2 alc_heavy 761.439 769.395 605.506 0.56674 0.54975
## 3 enzyme_test 750.509 760.454 595.297 0.65900 0.63854
## 4 pindex 735.715 747.649 582.943 0.75015 0.72975
## 5 bcs 730.620 744.543 579.638 0.78091 0.75808
## --------------------------------------------------------------------------
##
## Final Model Output
## ------------------
##
## Model Summary
## -------------------------------------------------------------------
## R 0.884 RMSE 184.276
## R-Squared 0.781 MSE 33957.712
## Adj. R-Squared 0.758 Coef. Var 27.839
## Pred R-Squared 0.700 AIC 730.620
## MAE 137.656 SBC 744.543
## -------------------------------------------------------------------
## RMSE: Root Mean Square Error
## MSE: Mean Square Error
## MAE: Mean Absolute Error
## AIC: Akaike Information Criteria
## SBC: Schwarz Bayesian Criteria
##
## ANOVA
## -----------------------------------------------------------------------
## Sum of
## Squares DF Mean Square F Sig.
## -----------------------------------------------------------------------
## Regression 6535804.090 5 1307160.818 34.217 0.0000
## Residual 1833716.447 48 38202.426
## Total 8369520.537 53
## -----------------------------------------------------------------------
##
## Parameter Estimates
## ------------------------------------------------------------------------------------------------
## model Beta Std. Error Std. Beta t Sig lower upper
## ------------------------------------------------------------------------------------------------
## (Intercept) -1178.330 208.682 -5.647 0.000 -1597.914 -758.746
## liver_test 58.064 40.144 0.156 1.446 0.155 -22.652 138.779
## alc_heavy 317.848 71.634 0.314 4.437 0.000 173.818 461.878
## enzyme_test 9.748 1.656 0.521 5.887 0.000 6.419 13.077
## pindex 8.924 1.808 0.380 4.935 0.000 5.288 12.559
## bcs 59.864 23.060 0.241 2.596 0.012 13.498 106.230
## ------------------------------------------------------------------------------------------------Hierarchical selection
When using p values as the criterion for
selecting/eliminating variables, we can enable hierarchical selection.
In this method, the search for the most significant variable is
restricted to the next available variable. In the below example, as
liver_test does not meet the threshold for selection, none
of the variables after liver_test are considered for
further selection i.e. the stepwise selection ends as soon as it comes
across a variable that does not meet the selection threshold. You can
learn more about hierachichal selection here.
# hierarchical selection
m <- lm(y ~ bcs + alc_heavy + pindex + enzyme_test + liver_test + age + gender + alc_mod, data = surgical)
ols_step_forward_p(m, 0.1, hierarchical = TRUE)
##
##
## Stepwise Summary
## --------------------------------------------------------------------------
## Step Variable AIC SBC SBIC R2 Adj. R2
## --------------------------------------------------------------------------
## 0 Base Model 802.606 806.584 646.794 0.00000 0.00000
## 1 bcs 797.697 803.664 640.655 0.12010 0.10318
## 2 alc_heavy 791.701 799.657 633.668 0.24119 0.21144
## 3 pindex 778.574 788.519 620.390 0.42659 0.39218
## 4 enzyme_test 730.924 742.858 579.087 0.77136 0.75269
## --------------------------------------------------------------------------
##
## Final Model Output
## ------------------
##
## Model Summary
## -------------------------------------------------------------------
## R 0.878 RMSE 188.249
## R-Squared 0.771 MSE 35437.709
## Adj. R-Squared 0.753 Coef. Var 28.147
## Pred R-Squared 0.695 AIC 730.924
## MAE 140.619 SBC 742.858
## -------------------------------------------------------------------
## RMSE: Root Mean Square Error
## MSE: Mean Square Error
## MAE: Mean Absolute Error
## AIC: Akaike Information Criteria
## SBC: Schwarz Bayesian Criteria
##
## ANOVA
## -----------------------------------------------------------------------
## Sum of
## Squares DF Mean Square F Sig.
## -----------------------------------------------------------------------
## Regression 6455884.265 4 1613971.066 41.327 0.0000
## Residual 1913636.272 49 39053.801
## Total 8369520.537 53
## -----------------------------------------------------------------------
##
## Parameter Estimates
## ------------------------------------------------------------------------------------------------
## model Beta Std. Error Std. Beta t Sig lower upper
## ------------------------------------------------------------------------------------------------
## (Intercept) -1334.424 180.589 -7.389 0.000 -1697.332 -971.516
## bcs 81.439 17.781 0.329 4.580 0.000 45.706 117.171
## alc_heavy 312.777 72.341 0.309 4.324 0.000 167.402 458.152
## pindex 10.131 1.622 0.431 6.246 0.000 6.871 13.390
## enzyme_test 11.243 1.308 0.601 8.596 0.000 8.614 13.871
## ------------------------------------------------------------------------------------------------